
James Brady
Level III Certified Infrared Thermographer
Brady Infrared Inspections, Inc.
935 Pine Castle CourtStuart, FL 34996Ph: 772-288-9884www.bradyinfrared.com
Abstract
Transmission lines are the critical backbone of the utility power grid. They are the “heavy lifters” of electricity, providing the link between electrical generation plants and substations that distribute power to the consumer. Power outages on these lines can be widespread affecting from several hundred to thousands of customers. Typical thermal problems occurring on such lines include loose connectors and splices. Equally to blame are failed insulators which are the result of damage due to corona discharge.
This presentation is based on a recent project that used solar-blind UV cameras and infrared thermal imagers to inspect a large transect of 138kV transmission lines in Florida. The results of this study will look at the common factors these technologies share and point out their unique strengths for inspecting transmission lines. Also presented is how drones were used to document and classify the severity of reported problems.
Introduction
Avoiding transmission failures is paramount for power utility companies. Failures have the potential to impact large sections of a power grid, and can be challenging for utility companies to restoring power in a timely manner. Unlike distribution outages that may affect tens or even hundreds of customers, transmission line outages can affect thousands and impact the operation of other electrical systems they are connected to.
A large majority of utility companies perform routine visual and infrared inspections to detect reliability threats. Some are also using solar blind ultra-violet (UV) cameras to detect corona on insulators and other components that are often missed with infrared or visual inspections. However, corona inspections are not as prevalent and that is unfortunate because corona activity poses serious threats to transmission system.
What brought our company into the world of solar blind UV camera inspections was one of our utility clients had experienced sudden and catastrophic failures on 138kV polymer insulators (Figure 1). This was a line that we were inspecting annually with infrared so it was no surprise that questions arose to the effectiveness of this survey. Looking at the failure pattern on the insulator(s) it was suspected that corona was to blame for the failures and performing an inspection specific to detect it would be beneficial.
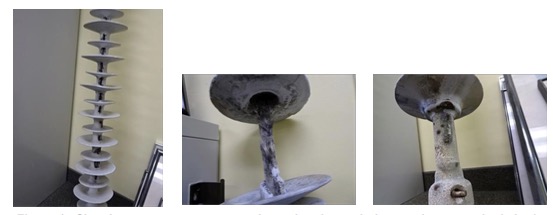
the failure pathway the fault followed to ground. Middle photo shows sheds closer to live end and
photo on left is the ground side; show existing path of electrical fault.
During our meeting, the use of UAS / drones equipped with a corona and infrared camera was discussed as an option to perform the inspection, but limited flight times and the need to maintain “line-of-sight” flying quickly put that to rest. We did, however, agree that using a drone to capture detailed images of problems we found would replace the need for a bucket truck to perform this task and ultimately save time and money.
Corona and Its Effects
Corona is an electrical discharge occurring in the high electrical field region, generally in the vicinity of conducting surfaces, but sometimes near insulating surfaces due to the ionization processes in air. The ionization process is a continual transfer of electrons being knocked out of orbit and being recaptured by atoms – this “recombination” event releases energy in the form of a light photon. This is the glow that is commonly observed in low light conditions on transmission lines and it is also what is observed by the solar blind UV camera.
For corona activity to exist a high electrical (E) field is needed, combined with how the shapes of an energized component influence that field. Sharp edges, corners, points, tight radius and other irregular objects within a high E-field all have the potential to initiate corona activity. Figure 2 shows three different insulator configurations and the resulting electrical fields that are produced. The black, orange and yellow areas show the areas of highest gradient. Notice how each of the different shapes influence the gradient and show vulnerable parts of the insulator within the high electrical field.
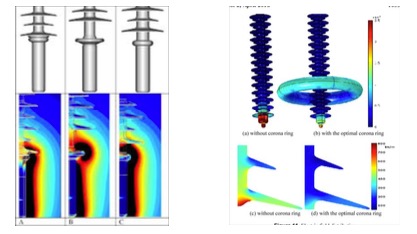
different shaped insulators. Right image shows the effects on
the electrical field with a corona ring installed.
When utilities are considering insulators they want to put in service for a specific voltage class, manufacturers will provide computer models to see where high E-fields exist and their interaction with the insulator. It is also used to determine if corona rings / field gradients are necessary. The right image in Figure 2 shows how useful corona rings are for dissipating and transferring the high E-field away from vulnerable parts of the insulator.
Corona has several effects on electrical systems and the surrounding air waves. They include:
- Corona consumes power – electricity is being lost to the air through the ionization process
- Corona causes electromagnetic interference that affects radio and television broadcasting
- Corona creates an audible noise
- Corona creates ozone (O3) that is very harmful to polymer insulators
- Corona creates mild concentrations of acid, also harmful to polymer insulators and metallic conductors and components
Solar Blind Ultraviolet (UV) Cameras
Solar blind UV cameras commonly referred to as corona cameras, are easy to operate but the picture one sees can be confusing to interpret without proper training and experience. Similar to a thermal camera that operates within specific wavelengths in the electromagnetic spectrum, solar blind ultraviolet (UV) cameras operate within the ultraviolet wavelengths. But, unlike infrared cameras that collect natural radiating energy, corona cameras filter out natural occurring solar UV energy and capture UV energy that is produced by corona and other UV generating sources.
The camera in its simplest form is an overlay of a visual image with a non-solar UV event. Looking through a corona camera one sees a visual image with “starburst” signals where there is corona activity (Figure 3). The stronger the activity, the more persistent and the “louder” the starburst signal will be.
corona activity on the live end conductor shoe.
Solar blind ultraviolet (UV) cameras do not share the popularity or recognition in the predictive maintenance world like infrared cameras do, and that is unfortunate because they serve a very useful purpose to detect corona emissions and radio frequency interference on utility transmission and distribution equipment. Most solar blind UV cameras are being used by in-house maintenance and inspection crews that work for large utility companies. In a lot of cases these cameras are under-utilized to their full potential. I believe the biggest reason for this is the lack of understanding of corona and the harmful effect it has on insulators, conductors, and connections.
Transmission Line Details
The transmission line under investigation is roughly 150 miles long with a voltage class of 138kV. A majority of the line runs along highway, with a small amount crossing water. Construction is a mix of polymer and ceramic insulators with vertical, horizontal, V-shape, and dead-end configurations. Some of the system is equipped with corona rings but most of it is not (Figure 4). The older sections of the line have insulators approaching 20 years in service.
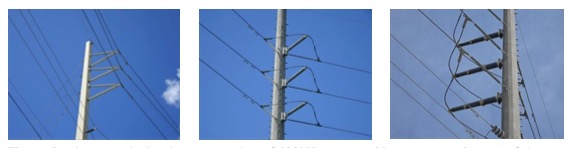
Left image shows 45-dgree bracing configuration of polymer insulators, common on most poles.
Middle image show a typical dead-end layout using polymer insulators.
Right image is a dead-end structure with a mix of ceramic post and polymer dead-ends.
Most of the polymer insulators are silica (Si) based rubber comprised of an inner fiberglass rod that is attached on both ends to metal end housings for attachment to the pole and the energized line. The entire assembly is encapsulated by the Si-rubber sheath with alternating sized sheds.
While very reliable for beading water and encapsulating surface pollution, the Si-rubber is susceptible to tears and degrades quickly with surface leakage current that occurs from build-up of pollution with lack of rain. Another weak spot on these insulators is the mold seam line where the encapsulating sheath meets the end housings. Here, water can enter the interior of the insulator, be wicked up through the fiber-rod and initiate partial discharge inside the insulator. Eventually, the sheath is punctured from the inside and corona activity begins on the exterior surface of the insulator. This process continues until eventually the arc-distance of the insulator is short enough to cause an electrical jump to ground.
Inspection Process
Both the thermal and corona inspections were carried out using vehicles. Water crossing were inspected using shallow-draft boats.
The corona inspection was carried out during daylight hours using an OFIL Luminar solar blind UV camera with a telephoto lens that provided scanning capabilities out to several hundred yards. Since corona activity is dependent on temperature and humidity many stretches of line were re-scanned at different times and on different days to assure that different atmospheric conditions were tested.
Atmospheric conditions were monitored and recorded through each day of scanning. Also recorded were GPS coordinates for each structure where an exception was documented. These data were used to generate a Google Earth KMZ file that that was incorporated into the final report.
The infrared scan was completed using a FLIR thermal imager equipped with a 12- degree telephoto lens. It was anticipated that corona activity, if detectable, would have small delta-T signatures, therefore it was imperative that solar loading on the insulators be avoided, so scanning started on average four hours after sunset.
The equipment that was inspected using both technologies included:
- Polymer Insulators
- V String
- Dead Ends
- Horizontal V String
- Porcelain Insulators
- Dead Ends
- Horizontal Line Post
- Hardware / Connections
- Line Clamps / Shoes
- Post and cotter pin assembly on dead-ends o Splices
- 4-hole pad connections on jumpers
- Static line / dead-end assemblies at poles o Line Vibration Dampeners
Corona Camera Findings
The solar blind UV camera was very successful in locating corona activity on various components. Some examples and discussions of the findings are presented.
- Live end of polymer insulators on dead-ends (Figure 5)
- 45-degree bracing insulator on horizontal V strings (Figure 6)
- Porcelain post insulators at the segment bolt connection and at the live end of the line shoe / clamp (Figure 7)
- Missing weights on vibration dampeners (Figure 8)
- U-bolt clamp connections (Figure 8)
- Cotter pin connections on dead-ends (Figure 9)
The corona pattern shown in Figure 5 is typical for what was found on dead-end structures; activity on the live-end mold seam line where the polymer sheath meets the end housing. There were 15 to 20 similar-type problems found during the survey.
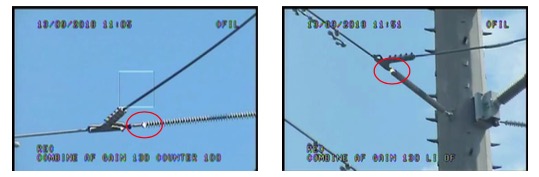
the live end of dead-end insulators (red circle).
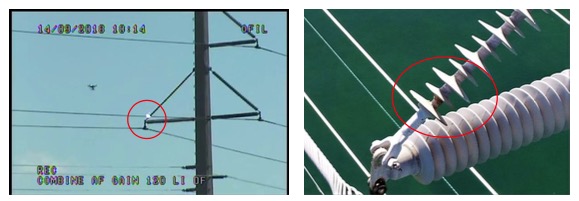
The corona pattern shown in Figure 6 was one a several findings of serious corona damage found on 45-degree bracing insulators. During the survey, three of these types of findings were immediately replaced and another 5 to 6 were scheduled for replacement over the next month. It is suspected that the smaller diameter insulator is causing the equipotential field to tighten significantly and generate a strong E-field; a favorable environment for corona to develop. The failure mode in this case is similar to that explained earlier, when water enters the interior of the insulator. The left image shows the migration pattern of corona activity and the shortening of the arc distance from the live end to ground.
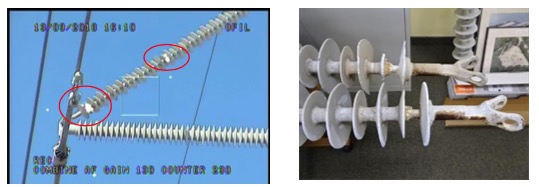
The photo on the right is a close up of two insulators that were found and immediately
taken out of service during the survey. Note the exposed fiberglass
rod at the site of corona activity.
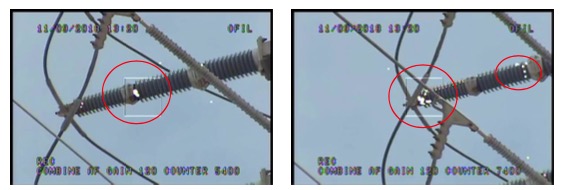
The photos in Figure 7 show corona activity on ceramic insulators. It is also possible that we are seeing dry-band arcing caused by surface leaking current due to pollution accumulation. Notice, however, that the arc-distance has been significantly reduced, especially on the right image.
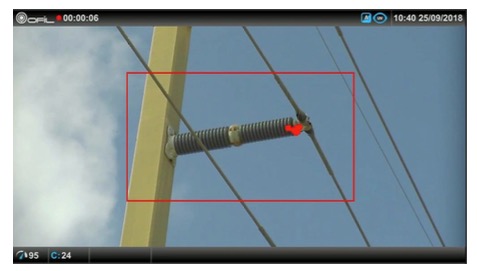
The photos in Figure 8 show corona activity on the point of where a line vibration dampener weight used to be (left photo). While not a critical threat to the system, the corona camera easily identified the damaged component, which is designed to control wind generated oscillations and reduce stress on conductor strands. The photo on the right shows corona activity on bolt ends on a line shoe. Again, not an immediate threat to the system, but the mild acids generated from corona will accelerate the oxidation process on hardware.
anti-vibration weight support and bolt ends on conductor shoe
The photos in Figure 9 show corona activity on a bolt-pin that holds the line shoe to the dead insulator. Close inspection showed that the cotter pin that prevents the bolt-pin from backing out and dropping the lines was almost completely deteriorated through long-term exposure to corona activity.
pin connections at the live end of the end-end inspector.
The examples shown above were all located using a solar blind UCV camera. Now let’s take a look at what the infrared camera found and discuss commonalities between the two technologies.
Infrared Camera Findings
As mentioned earlier, the infrared survey(s) were carried out after sunset to remove the effects of solar loading on the insulators and better detect small delta-T rises produced by corona and other defects not readily seen during a daylight infrared inspection.
In most instances, findings made with the corona camera were not detected with the infrared camera. Figure 10 is a good example of where corona was detected on a live- end of a 45-degree brace insulator but was not detected with infrared. These two images were taken on the same day, but hours apart. It is possible the corona activity had ceased and thus was not detectable with the infrared camera. It is also possible and more likely the corona activity was not strong enough to produce a detectable heat signature. In this case, the starburst observed with the corona camera was intermittent, and not as strong of a signal as observed on insulators with advanced stages of corona damage.
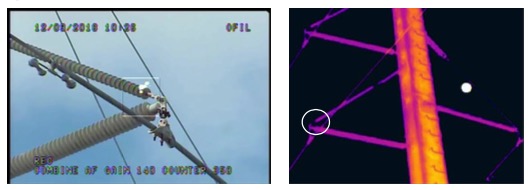
the infrared imager (white circle on thermogram is location of corona).
The large white spot in the background of the thermogram is the moon.
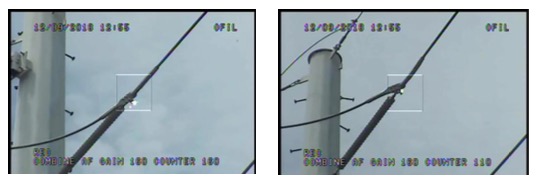
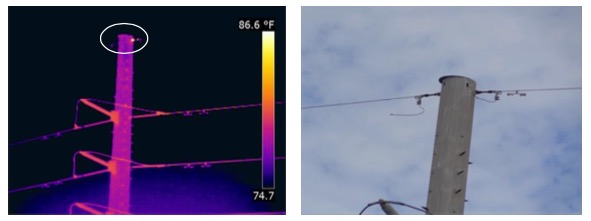
Corona was detected with infrared in a few cases where the activity was strong and provided a persistent signal when viewed through the corona camera. Figure 11 is a good example showing the heat signature of corona, but note that the signature is small and not obvious, lending itself to be easily missed to the untrained eye.
corona camera with a heat signature that was detectable
with the infrared imager (white circle shows small hot spot).
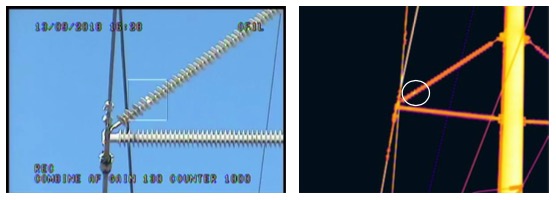
Corona activity and possibly dry-band arcing on ceramic insulators was readily seen with both the infrared and UV camera. Figure 12 shows typical patterns seen with the infrared corona camera on ceramic insulators with discharge.
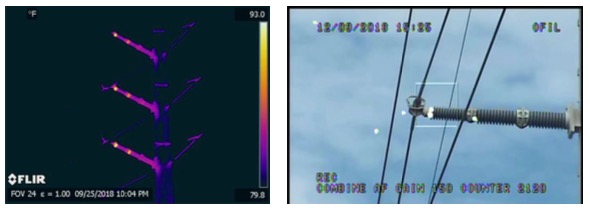
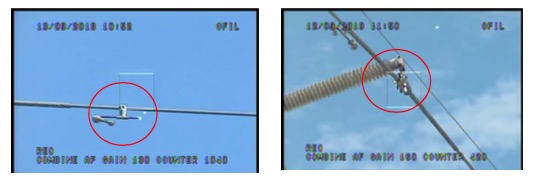
Detecting corona activity was the main focus of this inspection; however, ancillary problems were detected with infrared that were not seen with UV camera. One such problem was a hot spot detected at the dead-end connection of a static line jumper to a metal pole (Figure 13). The jumper wire is broken making the pole a ground point for lightning strikes. The hot spot is manifested by current flow generated from static electricity along the high line meeting resistance at the pole connection.
Note that the jumper wire is broken and causing the pole to be a new established grounding point.
The Use of Drones in This Project
The use of drones on this project was to collect visual photographs of corona damage found on structures that were not easily accessible. The left photo in Figure 14 shows a drone capturing photos of corona activity on a pole that is several hundred yards out over water. The use of a boat to collect this information would have taken several hours and tied up valuable resources from the Utility. The drone accomplished this task in less than ten minutes and provided information that ultimately led to the decision to replace the insulator the following day.
on an insulator. Right image shows severity of damage with the fiberglass rod exposed
and allowing water to infiltrate the interior of the insulator.
Conclusions
This paper highlights the capabilities of merging infrared and solar blind UV cameras to detect reliability threats to a 138kV transmission system. The utility company who owns and maintains it knew they were vulnerable, but had no way of knowing to what degree. This survey identified those vulnerabilities and allowed corrective action to be taken thus avoiding additional outages similar to ones they had recently experienced.
Several findings found from this survey were critical enough in nature that they required immediate corrective action. Other non-critical problems found have been planned for replacement over the next year.
Utilities that own and operate transmission lines should consider adding a corona inspection to their maintenance program, if they are not doing so already. Corona is a continuous process of degradation that affects insulators and other components vital for the safe and reliable operation of transmission line systems.
Predictive maintenance specialists use multiple technologies they know are best for finding specific problems they are looking for. This study is a great demonstration of that and shows that not one technology should be relied on as the “single tool” for evaluating transmission lines. The infrared camera was able to detect corona activity in cases where the heat produced by ionization was sufficient enough to be detected. Conversely, there were several instances where corona was present, but did not produce the necessary heat to be detected by the infrared camera. Likewise, the corona camera detected all stages of corona activity but had no capabilities to detect resistance related problems the infrared camera found.
The ease and flexibility of deploying a drone to assess corona damage on equipment proved valuable for collecting important imagery to help evaluate the severity of problems found. The decision not to use drones to carry the infrared and corona cameras was based on the fact that the ground survey was more time and cost effective given the easy access the lines allowed. However, this may not be case for every inspection and knowing that drones are available to perform inspection work should be considered on a case by case basis.
