
Dr. Robert Madding: Director, Infrared Training Center
Ed Kochanek, Presenter:FLIR Systems, Inc.
25 Esquire RoadNorth Billerica, MA 01862978-901-8000www.flir.com/thermography/americas/us/
Abstract
A thermal imaging camera taking a high definition thermogram gives one the potential to find smaller problems at greater distances that might be missed with a lower resolution thermal imaging camera. High definition thermal imaging refers to the fine detail and clarity of a thermal image, which means it contains a large number of pixels per unit of area, which generally results in greater temperature measurement accuracy, particularly for small objects. This paper discusses the differences in temperature measurement among three infrared (IR) cameras with different spatial resolutions. The targets used were actual field problems. This was not a laboratory experiment, but a real-world test of these cameras. Images were taken under the same conditions at the same distance with all the IR cameras. The results show there can be dramatic differences in temperature readings, illustrating the importance of adequate resolution when making temperature measurements with infrared cameras.
Introduction
Many modern IR cameras have built-in cross-hairs that show the user the size of the spot being measured. One would think this would solve the problem of measurement error due to a target at too great a distance for its size and IR camera resolution. But in our haste as thermographers under pressure to get results, we often don’t take the time to ensure sufficient target size, or we use a function such as the maximum temperature in a box that does not show whether the target is adequate for measurement. Or, we don’t have adequate optics or IR camera resolution to get a good measurement of a distant target that just isn’t quite large enough.
Whether the measurement errors resulting from inadequate spatial resolution really matter depends on the magnitude of the error and the criticality of the target. In our study, we found a critical problem on a substation transformer at 40% load that could certainly devolve into a major failure as the load increased to 100% with increasing demand.
The question arises as to how much difference this makes anyway. The answer isn’t that simple. The degree of measurement error depends on target temperature, size, distance, IR camera and what is behind the target. The worst case scenario is found in outdoor electrical applications where there are numerous targets a few inches or smaller in size that can be 25 to 80 feet distant with no opportunity for the thermographer to get closer. Frequently, behind these targets is a clear, dry sky whose temperature can approach -50°F or colder. The infrared camera averages what it captures for a given measurement spot size; when you average in -50°F you can get significant measurement errors even for hot targets that are just a bit too small for the infrared camera and optics in use.
Adequate IR camera resolution is a combination of the infrared camera’s detector and optics. The wise thermographer ensures the right system is available for the job at hand. This paper illustrates, with real world measurements on actual thermal anomalies found in the field, the magnitude of error one can expect with 3 different resolution IR cameras using their standard optics. All measurements were made at about the same time from the same distance on the same targets under the same environmental and load conditions using different models (shown in parentheses below) of FLIR Systems cameras. For brevity, we will call them low, medium and high resolution IR cameras. The low resolution camera has 160 horizontal by 120 vertical pixels (E65), the medium resolution camera 320 horizontal by 240 vertical pixels (P65HS) and the high resolution camera 640 by 480 vertical pixels (P640) in their respective detector arrays. Also for brevity, we use “resolution” for “spatial resolution” in this paper.
One quickly recognizes the number of pixels increases by a factor of 2 in each direction, resulting in detector arrays for the medium resolution camera having 4 times as many pixels as the low resolution and the high resolution camera having 16 times as many pixels as the low resolution IR camera.
We documented the distance between the IR cameras and the target using a laser range finder accurate to 1.5 feet for targets beyond 11 yards. For closer targets we estimated the distance, as running a tape measure to live switchgear was deemed unsafe. In some cases we had to estimate target size for the same reason. Results are presented as brief case studies.
Discussion
Case Study 1: Pole Switch
Figure 1 shows an IR and visual image pair of a problematic mechanical disconnect on a 23kV distribution system. These connections are between an underground feed and the overhead lines. All the IR images for this case were taken with the cameras in their standard configuration with no additional optics at a range of 36 feet.
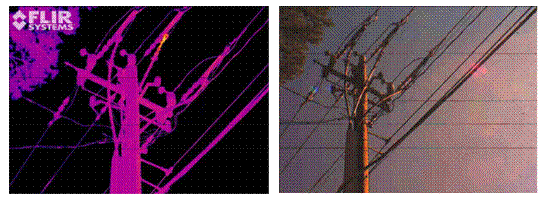
Figure 1. High resolution IR image and visual counterpart of a set of 23kV distribution switches.
The center phase shows a significant temperature rise. Distance to target is 36 feet.
Figure 2 shows the medium (left) and low resolution IR images of the same set of switches.
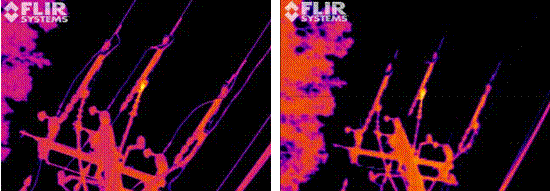
Figure 2. Medium (left) and low resolution images of the same setup as in Figure 1.
We thermally tuned the level and contrast of each image for maximum “viewability” of the problem, so the temperature scales are close, but not exactly the same. In all cases the thermal anomaly can be seen, but it is much clearer in the high resolution image, to the extent one can see the bolt patterns on the connection. However, if this were the extent of the difference, one could justifiably argue using a lower resolution IR camera, hence lower cost would suffice. But what do the temperature measurements show? Table 1 gives the measurement summary.
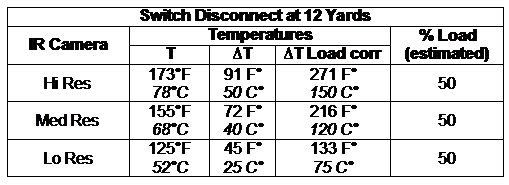
Table 1. Measured temperature, temperature rise and load corrected temperature rise for
three IR cameras of different resolution. Target distance is 36 feet.
It is very interesting to see the high resolution IR camera gives twice the delta-T (∆T) temperature rise as the low resolution IR camera and 25% more than the medium resolution camera. For this study, we used an emissivity of 0.95 for all cameras; probably not exact, but this emissivity will give a temperature reading lower than the actual reading. The differences will only increase as the emissivity is lowered. So, we are considering the best case scenario for measurement comparisons among these cameras.
We estimated the load at 50% based on our utility contact’s experience. The temperature rises calculated for 100% load1 are given in the column labeled “∆T Load corr”. For one set of severity criteria used by the Electric Power Research Institute (EPRI), the load corrected temperature rises are in the critical category (135 F° rise or higher) for the high and medium resolution cameras and almost critical for the low resolution camera.
The bottom line is all the infrared cameras would detect the problem, but without a telescopic lens on the low and medium resolution cameras, incorrect readings would have been obtained and the level of severity would have been significantly underestimated. The disadvantage of telescopic lenses, besides expense, is they reduce the field of view and enhance the optical leveraging. The latter means it is more difficult to get a good, stable image with a telescopic lens attached, as any small motion of the IR camera is magnified by the power of the telescope. This is why digital camera companies have patented image stabilizing telescopes for their cameras. The thermographer can still accomplish the task – it just takes longer with a telescopic lens.
Case Study 2: Substation Transformer Jumpers
Figure 3 shows an IR image and visual image pair of a 115kV to 23kV substation transformer low side with definite problems on two of the phases. The jumpers from the bushings to the feed are stranded cables where some of the strands have broken over time or are not well connected. This causes overloading of the remaining good conductors resulting in significant heating. This is often termed “barber poling” for obvious reasons.
Measured load on this transformer was 40% of maximum. Range was 33 feet. Cable diameter is nominal 3/4”. This was taken in early June when the weather was cool and electrical demand in the area was low. Figure 4 gives the medium (left) and low resolution IR camera images of the same scene.
Again, the thermal anomalies were picked up by all the infrared cameras, so these problems would not have been missed.
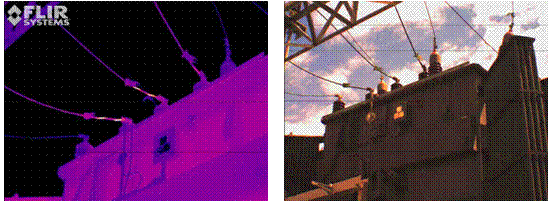
Figure 3. High resolution thermal image of a 115kV to 23kV substation transformer low side.
Significant thermal anomaly on left and center phase jumpers due to some strands
broken or poorly connected. IR image effect is often termed “barber poling”.
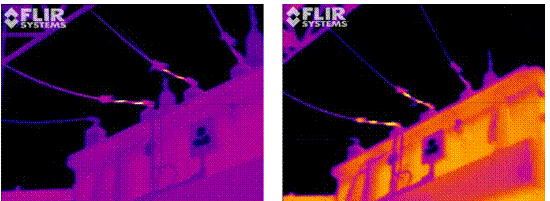
Figure 4. Medium (left) and low resolution images of the same setup as in Figure 3.
But what about the temperature readings? Table 2 gives a comparison of maximum temperature readings for the left-most phase with barber poling. For this study, the results are even more dramatic than for the pole switch. Here, the ∆T measured with the high resolution camera is over 2.3 times that of the low resolution camera. And the problem severity according to the EPRI criteria is critical at 40% load for the medium and high resolution measurements!
The load corrected temperature rises are of great concern. We deemed the problem so significant we sent a report immediately to the utility that owns the substation transformer. Because, when air conditioning season hits, there is a very high probability of failure of this system, with load temperature rises at full load estimated as approaching 900°F.
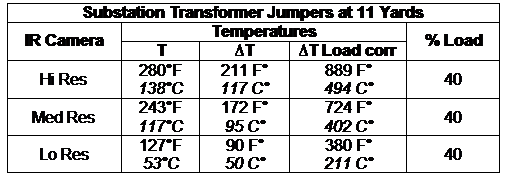
Table 2. Measured temperature, temperature rise and load corrected temperature rise
for three IR cameras of different resolution. Target distance is 33 feet.
Case Study 3: Generator Tie-in Breaker
Figure 5 shows the high resolution IR and visual image pair of a 480 volt generator tie-in breaker at a paper mill. This breaker had a 3,000 amp load at the time of measurement, estimated at 75% of full load.
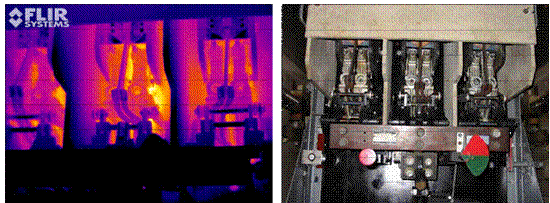
Figure 5. High resolution IR image and visual photo of 480 volt generator tie-in breaker.
We estimated the distance at 4 feet, though the problem was somewhat in the rear of the switchgear and could not readily be identified. It was definitely a problem with temperature rises somewhat lower than the above examples, but still significant. If the tie-in breaker fails, the paper mill production shuts down until it is repaired.
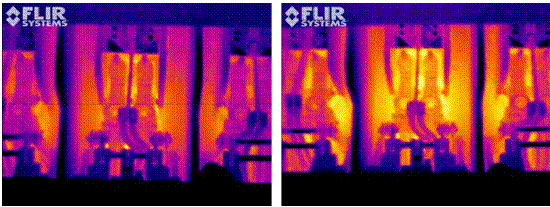
Figure 6. Medium resolution (left) and low resolution IR images of 480 volt generator tie-in breaker.
Table 3 gives the temperature data for this case study. Here, the differences among the cameras are less significant than in previous examples due to the closeness of the range and size of the target.
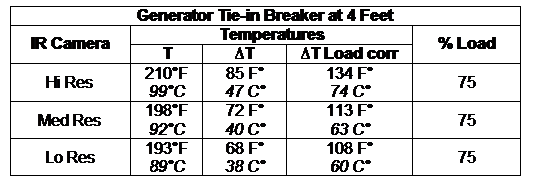
Table 3. Measured temperature, temperature rise and load corrected temperature rise
for three IR cameras of different resolution. Target distance is about 4 feet.
There is enough difference so the load corrected high resolution ∆T is right at the EPRI critical level, where the low resolution ∆T is still in the middle of the serious category. Having said that, the EPRI severity criteria are used here just as an example for comparison purposes. The Infrared Training Center does not advocate any specific set of severity criteria as there needs to be a lot more research done. Much of what is published is based on experience and a desire to have something to go on. There are many sets of severity criteria published and they are all different. See the paper by Giesecke for additional comments and insight on severity criteria.
Summary
High resolution IR cameras can get significantly better temperature readings for small targets at some distance. The targets in this study were all on the size of the smallest dimension of about an inch at ranges from 36 feet to 4 feet. The biggest differences were understandably seen at the largest distances.
While one could expect results similar to the high resolution camera by applying a 4X lens to the low resolution camera or a 2X lens to the medium resolution camera, there are distinct advantages to not having to use a telescopic lens. A telescope reduces the field of view by the power of the optic, requiring more care in aiming and target acquisition. It also magnifies movement in the same manner. This adds an additional requirement to the thermographer to somehow achieve stability either through some type of rest, mount or tripod. A telescope is another optic to care for and be careful of as they can be easily broken.
For applications beyond electrical anomalies, where large surfaces need to be imaged such as building applications, the high resolution IR camera has a distinct advantage in that one must take 16 images with the low resolution camera, either at one-fourth the distance or with a 4X telescope, or 4 images with a medium resolution camera at one-half the distance or with a 2X telescope to cover the same area as the high resolution camera with one image. Think of the time saved in not having to stitch together all those IR images!
Thermographers should be aware of their target sizes and have an appreciation for the demands of measuring small targets at distance. Many of us prefer the “maximum temperature in a box” feature on IR cameras. But, use it in conjunction with the spot measurement, as the spot measurement can show you if your target is large enough. You can spot problems and still be fooled into making temperature measurements if you don’t have enough resolution in your IR camera.
Acknowledgements
The authors wish to acknowledge the cooperation of Carmine Luongo and Mark Moriarty of National Grid and Ken Leonard and Donald Smith of Progress Energy for their assistance in locating thermal anomalies in the real world of electric power utilities. We also acknowledge the cooperation and assistance of Mike Farrell, Plant Manager, of Haverhill Paperboard for allowing us to do a quick infrared survey of his facility.
References
1. Madding, Robert P., Leonard, Ken, Orlove, Gary L., “Important Measurements that Support IR Surveys in Substations”, InfraMation Proceedings, pp. 19-25, September, 2002.
About the Author
Bob Madding is a graduate of the University of Missouri with a BS in Physics, and a Masters and Ph.D. in Physics from the University of Wisconsin-Madison. He began the first infrared thermography seminar at the University of Wisconsin Extension in 1978. He co-founded the Thermosense Conference in 1978 with two other colleagues from the UW. In 2000, he founded the InfraMation Conference, the largest annual IR conference for thermographers. Bob holds an ASNT NDT Level III in Thermal Infrared and an EPRI Level III in IR thermography. He has published numerous technical papers on the applications of infrared thermography, as well as contributing chapters to textbooks such as Applied Thermal Design and the Encyclopedia of Optical Engineering. Bob has over 25 years experience in infrared thermography applications and training.
Visit out Sponsors:
![]()
Electrophysics