Ed Kochanek
Infrared Training Center
FLIR Systems Inc.
25 Esquire Road
North Billerica, MA 01862
Abstract
Thermal imagers have long been used to detect evidence of problems within a wide variety of systems and structures including electrical distribution systems and building envelopes. In order to fully quantify the severity of problems other information is often critical such as electrical load data and moisture levels. Recent developments now permit wireless transmission of vital diagnostic data from clamp-on ammeters and moisture meters directly to the infrared camera.
This paper will discuss how FLIR’s revolutionary MeterLink technology can help thermographers to document electrical load conditions including energy consumption and load imbalances. This paper will also show how building inspectors and restoration specialists can quantify and document moisture levels in building structures, providing clients and insurance companies with quantified recommendations for dry times and damage estimates.
Dicussion
Infrared Cameras
In the last 15 years there have been many advances in helping thermographers collect data necessary to complete an infrared camera report. Some of these advances have included voice annotation, text comments and visual camera integration. All of these advances have reduced the time to create a professional report. In the past, a thermographer could expect to spend an equal amount of time creating the report as it took to do the physical inspection. Fortunately that is no longer the case.
The latest time saving innovation has been MeterLink. MeterLink is the ability to have test and measurement instruments integrate with thermal imagers via bluetooth.
The first two instruments to have MeterLink capabilities are a clamp and moisture meter. Both the clamp and moisture meter are used in conjunction with the infrared camera to give a complete picture of the problem.
Clamp Meters
Most thermographers are familiar with a clamp meter. Today’s clamp meters have many capabilities and are considered the Swiss Army knife of test tools. The basic function of the clamp meter is to measure the load current.
Most infrared reports have the load current listed as part of the report. This is important as the load has a direct correlation to the increase in temperature.
A temperature only reading is usually insufficient information with respect to diagnosing a potential problem. A correct understanding of the equipment being inspected is essential if one is to make a proper thermographic diagnosis. Understanding how current loads contribute to temperature is an integral factor in evaluating the severity of a fault.
To comprehend why current load is important with respect to temperature measurements, it is necessary to understand how heat is generated in electrical equipment. There is a fairly straightforward relationship between current (I), resistance (R) and power (P). The power generated through a circuit is the product of the current squared and the resistance. Or:
P = I2R
All conductors used in electrical equipment have some resistance. Therefore, power will be generated in any conductor carrying a load. Properly operating electrical equipment will have a thermal signature that depends on the type of equipment, environmental temperatures, current load and how long the equipment has been under load. In general, conductors that have been carrying a reasonable current load continuously, over an extended period of time, will look hotter than their surroundings. It is normal for conductors to heat up. Guidelines suggest that thermographic surveys should be conducted at maximum load, or at some reasonable percentage of maximum. Most electrical faults are essentially high resistance paths caused by loose connections or corrosion. If we assume that resistance remains fairly constant, consider what happens as the load increases:
If the load doubles, the power increases by a factor of four
If the load triples, the power increases by a factor of nine
If the load quadruples, the power increases by a factor of sixteen
These values clearly indicate the importance of current load with respect to power dissipated through a high resistance path.
Here is a sample of a very popular severity chart.
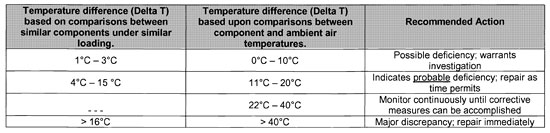
Figure 1
In a real life situation let’s say the Delta T measurement was 15C° between two phases, and the measured load was only 30% of normal. The recommended action according to the chart (figure 1) indicates that you should repair as time permits. However, if the load returned to normal, the Delta T could easily increase beyond 40 C degrees because the power increased by a factor of 9. The new recommended action would be to repair immediately. This shows the dramatic rise based solely on the increased current.
The ability to wirelessly capture, using MeterLink, this important data to the thermal image, reduces the amount of error possible when creating a report or discussing your findings with your customer or supervisor.
In figure 2, the image includes the clamp meter load data. As you can see, the camera is able to record the Delta T between the three phases. Below the temperature measurement is the load reading from each of the three corresponding phases.
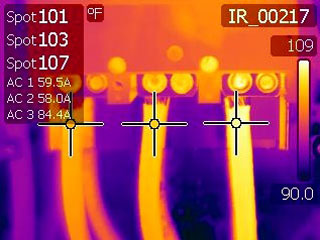
Figure 2
Moisture Meter
Starting in 2003 infrared cameras were specifically manufactured to detect the presence of moisture. The reason is that it became economically feasible to manufacture cameras that your average restoration company could afford. Cameras replaced moisture meters as the primary tool in detecting hidden moisture problems.
The problem is that infrared cameras do not detect moisture directly. The camera detects a cold area created by moisture as it evaporates. Under most environmental conditions when moisture is exposed to air it is evaporating. Basically, if it’s wet it is cold.
Once a cold area has been detected, the thermographer uses his moisture meter to confirm the findings. As we know a cold spot does not always mean that it is wet. The results on the moisture meter are generally the amount of moisture in a building material. These data are essential for the report the thermographers will give to their client.
By wirelessly transmitting the moisture content, the thermographer can capture the picture with his infrared camera and log the data on the image. This is important because that image can now be emailed or used in a report for his customer. By capturing this data on the image the thermographer saves a step in recording the data and now the information goes wherever the image goes – a tremendous time savings since the image is date and time stamped as well.
The ability to track the evaporation of moisture on a surface is also important. As infrared images are being shared with customers, clients have the ability to store all the data on a sample image, which becomes a powerful tool in solving problems.
As we can see in figure 3, the camera has detected a cold spot. The Delta T between spot 1 and spot two is 6.3 F degrees.
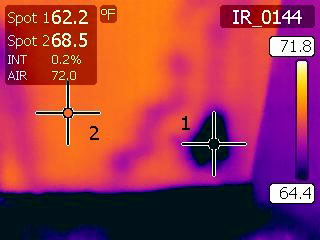
Figure 3
The moisture meter is placed on the target and we can measure the moisture content. This reading is now wirelessly transmitted to the camera for full documentation. In figure 4 you can see the arrow pointing to the percent of moisture content.
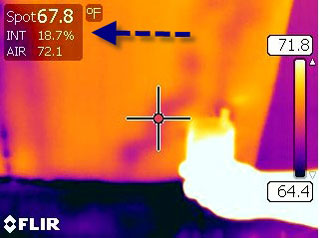
Figure 4
If, for example, a restoration company needed additional fans, having a picture with the moisture level will go a long way to help convince the insurance company to cover any additional expenses.
If someone is questioning how long it’s taken to dry out a building material such as drywall, you can go back to the time stamped images with the moisture data to verify how long it’s been.
The benefit is all the data is in one location making archiving and researching this data very easy.
Conclusion
The advances of data recording to infrared camera images is increasing at a rapid rate. MeterLinkTM is the latest feature to seamlessly capture important information necessary to complete a professional report or project.
Thermographers and customers are able to make important decisions in real time and that allows them to save money, effort and stress.
References
Bernard R. Lyon, Gary L. Orlove, Donna L. Peters. “The Relationship Between Current Load and Temperature for Quasi-steady State and Transient Conditions”. Thermosense XXII.
About the Author
Ed Kochanek has been with FLIR for over 11 years. The last three years he has been the Regional Director of Sales for the Eastern Region, Thermography Division.