Understanding Proprietary Infrared Image Files
Fred Colbert
Professional Thermographers Association
Abstract
This paper outlines the limitations and hurdles that thermographers must face when dealing with infrared images where the radiometric data is stored/encrypted within a proprietary file format (.IMG, .JPG, .SIT, .IS2, .IRI, .ANA, .TIF, .FTS, etc.). Many of the older file formats are no longer being supported as camera manufacturers continue to merge with each other and have product lines that overlap. This leads to many problems because the data that are stored in these image files becomes inaccessible.
A development program has been funded by the Professional Thermographers Association and Ford Motor Company to solve this problem. The solution is to provide a cross-platform compatibility user interface and digital IR Image archival format that allows for conversion and upgrade to a standardized file format.
This format will simultaneously provide for archival of historical image files/data, upgrade the capabilities, and remove the limitations that have been intentionally placed on all IR image file formats by the camera manufacturers. A global development team comprised of leading thermographers and software engineers has been working on the establishment of a standardized image file format that will ensure the availability and usefulness of data/image file formats for years to come.
Proprietary Infrared Image Files
Today, anti-competitive forces have led to the existence of well over 20 proprietary infrared file formats of various types, vintages and complexities.
The explanation for this is as follows: Radiometric IR images contain both a spatial representation of the scene and data that are used to measure (as temperature) the radiant energy seen by the camera. The standard image file formats (.BMP, .TIF, .JPG, or .GIF) were designed for use within popular image viewing software such as Microsoft Paint, Adobe Photoshop, or Jasc Paint Shop Pro; these formats were not designed to facilitate sophisticated analysis of the radiometric data stored within IR image files.
(Note: Do not be confused. FLIR uses file extensions of .JPG, and .TIF which are also used as extensions for digital photo files; however, the FLIR file structure for the radiometric image is completely different. You cannot get radiometric data out of FLIR .JPG or .TIF files without using FLIR’s Proprietary software).
When it became possible to perform various kinds of computer analyses on infrared images, there was no standardized file format ready-made to fit. Each camera manufacturer developed a file format on its own. They soon began to see this as a competitive advantage, but one which immediately created long lasting limitations for the camera users. None of the camera manufacturers wanted to let the other manufacturers know what data they were storing or not storing in their image files. So, the infrared imaging industry, the consumers, never saw any effort put into establishing a standard file format that would allow for cross-platform compatibility amongst the camera manufacturers.
These proprietary image files continue to be viewed as a competitive advantage by each of the IR camera manufacturers, and continue to serve to “lock in” customers to only one manufacturer. In order to analyze images from an IR camera, the user first has to invest heavily in proprietary software designed specifically for the file type generated by that manufacturer’s camera. The “walls” (computer file structure) put up around the proprietary IR image file formats by the camera manufacturers intentionally and successfully keep third party software development companies out of “their” marketplace. This limits the offerings available to thermographers who are now “locked in” to proprietary software at whatever price is set by the manufacturer. Thus, when the time comes for the customer to purchase another infrared camera, the choice is a non-choice: stay with the same manufacturer (and pay uncompetitive prices), or else invest, again, in yet another proprietary software (at uncompetitive prices), and resolve to run multiple IR analysis programs, one for each camera manufacturer, ad infinitum.
This is obviously a great thing from the perspective of the IR camera manufacturer, but it is considerably one-sided from the perspective of the thermographer. It places them, their images, their entire IR program, and their company’s equipment investment at considerable risk. Note the following:
3. As computer operating systems advanced, many of the older software packages would not run on the newer operating systems, placing all of the data at an enormous risk of becoming entirely useless.
4. By forcing customers into purchasing from a specific IR manufacturer because of historic purchasing decisions, the manufacturers have limited the thermographer’s IR program or services from utilizing many of the new, innovative features and benefits (such as lens / filter options ) that may be offered by another camera manufacturer.
Lessons Learned from Past Mistakes of the Digital Photographic Camera Industry
Not so long ago, in the world of still photography, each of the camera manufacturers was forced to recognize that the consumer market for photographic cameras was shifting from film to digital photography. Camera manufacturers like Canon and Kodak started to develop their own proprietary image file formats that would lock customers into using just their cameras and software. This effort met with a huge resistance from the marketplace because, while they were trying to lock in customers, other manufacturers understood that customers wanted to have the freedom to choose what software they used to view, adjust and print their images. It did not take long for Kodak, for example, to see that if they were going to continue to proceed down this road, they would be losing sales. Customers wanted the freedom to choose which programs to use to work with their images. Kodak dropped the .KDC file format and adopted the .JPG or .RAW file formats that are now common across all of the photographic cameras on the market. Today you do not see any of the digital camera manufacturers trying to lock their customers into a proprietary file format like the .KDC from Kodak.
IR Image Files – Looking “Under the Hood”
Just what data are stored inside an IR image file? It is not a simple task to find out. There are quite a number of questions that must be answered before it can be determined what’s really there:
-
What is the physical size of the detector? (not the published size, as these can differ)
-
What image data is actually imaged / scanned versus interpolated?
-
What are the actual ratio/dimensions, height vs. width, of the pixel element?
-
What is the dynamic range of the IR image – 8, 12, 14, 16-bit?
-
What is the slope of the calibration curve for the camera’s range?
-
Are there any offset corrections that influence the calibration of the curves?
-
What analysis tools were in use at the time that the image was stored?
-
What are the embedded image metadata (see below) that have been written into the file?
-
Is there a Pallet file that is stored in the image, or just data about what file to use?
-
Additionally, are there also embedded into the image file:
-
Voice dictation files?
-
Text files?
-
Photographic image (daylight image) files
-
-
Is the image file using a “lossless”, or a “lossy” file compression algorithm?
Additionally, this task has been made even harder by the fact that a considerable amount of effort has been made by the camera manufacturers to make it, in many cases, almost impossible for the thermographer to be able to get at his data. The use of different compression / encryption algorithms has only complicated this task even further.
Embedded Image Metadata
Metadata (from the Greek and Latin), literally “data about data”, is information that describes another set of data. A common example is a library catalog card, which contains data about the contents and location of a book; it is data about the data in the book referenced by the card. The metadata which are embedded with content are called embedded metadata.
In the case of the IR image, this would be specific data about the actual IR camera that was used to create the image file, its serial number, time and date, lens and range info, software and calibration versions. Here’s an example:
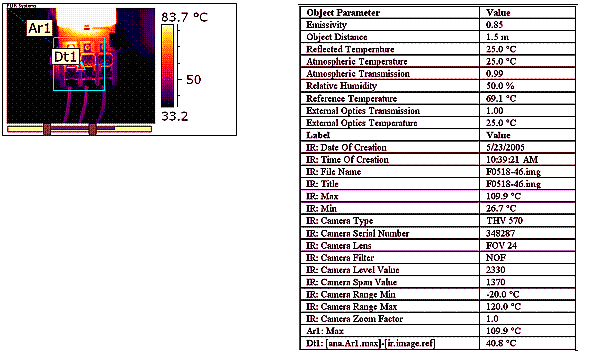
Analysis Tools and Results Data Stored in the Image File
With many of the IR cameras today, you can actually save many of the camera’s software analysis tools right into the IR image file at the time you store the image. For example, if you were using a spot and an area measurement tool at the time that the image was stored, then the XY coordinates of those tools were stored in the image file, as well as any of their reference temperature values. This allows you to recall the image in the camera or in the desktop software and not have to recreate the analysis each time the image is opened.
Color Pallets
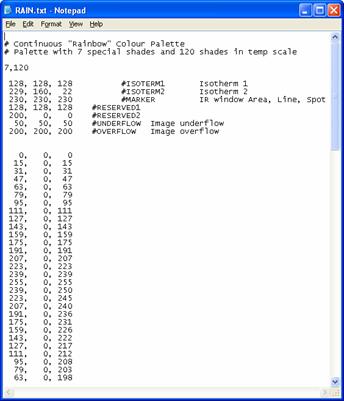 Infrared images use many different color pallets to convey visually different amounts of radiance. A radiance map that shows the color pallets used may be in the form of a grayscale or in color depending on what the thermographer is trying to show in the thermogram. These color pallets can be created in many different ways and are stored in a table of RGB values (Red, Green, Blue) from 0 to 255.
For example, in the table on the right, it is of a “Rainbow” color pallet that has 7 colors reserved for markers. Only 120 colors in the pallet file make up the rainbow color values of Red, Green, and Blue as a table of descending numbers below. You can create your own color pallet files by editing the *.PAL files as a TXT file and then resaving them back as a *.PAL file. Using Microsoft Excel can also be used to edit the values of the table.
File Codec (Compression/Decompression) Algorithms: Lossy vs. Lossless
Lossless and lossy compression are terms that describe whether or not, in the compression of a file, all original data can be recovered when the file is uncompressed. With lossless compression, every single bit of data that was originally in the file remains after the file is uncompressed. All of the information is completely restored. This is generally the technique of choice for text or spreadsheet files, where losing words or financial data could pose a problem. The Graphics Interchange File (GIF) is an image format used on the Web that provides lossless compression.
On the other hand, lossy compression reduces a file by permanently eliminating certain information, especially redundant information. When the file is uncompressed, only a part of the original information is still there (although the user may not notice it). Lossy compression is generally used for video and sound, where a certain amount of information loss will not be detected by most users. The JPEG image file, commonly used for photographs and other complex still-images on the Web, is an image that has lossy compression. Using JPEG compression, the creator can decide how much loss to introduce and make a trade-off between file size and image quality.
Lossy vs. Lossless Compression
It can be seen that the advantage of lossy methods over lossless methods is that in some cases a lossy method can produce a much smaller compressed file than any known lossless method, while still meeting the requirements of the application.
Lossy methods are most often used for compressing sound, images or videos. The compression ratio (that is, the size of the compressed file compared to that of the uncompressed file) of lossy video codecs nearly always exceed those of the audio and still-image equivalents.
-
Audio can be compressed at 1:10 with no noticeable loss of quality
-
Video can be compressed much further with little visible quality loss, e.g., 300:1
-
Lossy compressed still images are often compressed to 1/10th their original size, as with audio, but the quality loss is more noticeable, especially on closer inspection.
Note: It should be noted that “lossy” file compression is NOT acceptable for thermographic images since there is no acceptable level of loss of image data because the image is the data.
When a user acquires a lossy-compressed file (for example, to reduce download-time) the retrieved file can be quite different from the original. Flaws caused by lossy compression that are noticeable to the human eye or ear are known as compression artifacts.
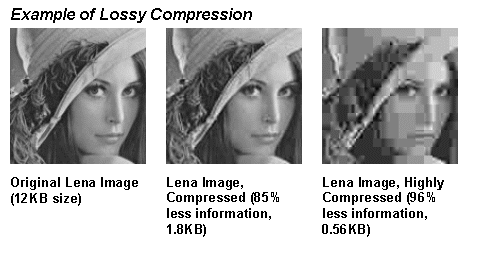
The above images show the use of lossy compression to reduce the file size of the image. (The image of Lena is a de facto industry-standard test image).
-
The first picture is 12,249 bytes
-
The second picture has been compressed (JPEG quality 30) and is 85% smaller, at 1,869 bytes. Notice the loss of detail in the brim of the hat
-
The third picture has been highly compressed (JPEG quality 5) and is 96% smaller, at 559 bytes. The compression artifacts are much more noticeable
Even though the third image has high distortion, the face is still recognizable. Good lossy compression algorithms are able to throw away “less important” information and still retain the “essential” information.
Lossless Data Compression
Lossless data compression is a class of data compression algorithms that allow the exact original data to be reconstructed from the compressed data.
Lossless data compression is used in software compression tools such as the highly popular ZIP file format, used by PKZIP, WinZip and Mac OS 10.3, and the Unix programs bzip2, gzip and compress. Other popular formats include Stuffit, RAR and 7z.
Note: Lossless compression is used when it is important that the original and the decompressed data are identical, or when no assumption can be made on whether certain deviation is uncritical.
Typical examples are executable programs and source code. Some image file formats, notably PNG, use only lossless compression, while others like TIFF and MNG may use either lossless or lossy methods. GIF uses a technically lossless compression method, but most GIF implementations are incapable of representing full color, so they quantize (quantize – apply quantum theory to; restrict the number of possible values of ((a quantity)) or states of ((a physical entity or system)) so that certain variables can assume only certain discrete magnitudes that are integral multiples of a common factor) the image (often with dithering) to 256 or fewer colors before encoding as GIF. Color quantization is a lossy process, but reconstructing the color image and then re-quantizing it produces no additional loss. (Some rare GIF implementations make multiple passes over an image, adding 255 new colors on each pass).
Pixels
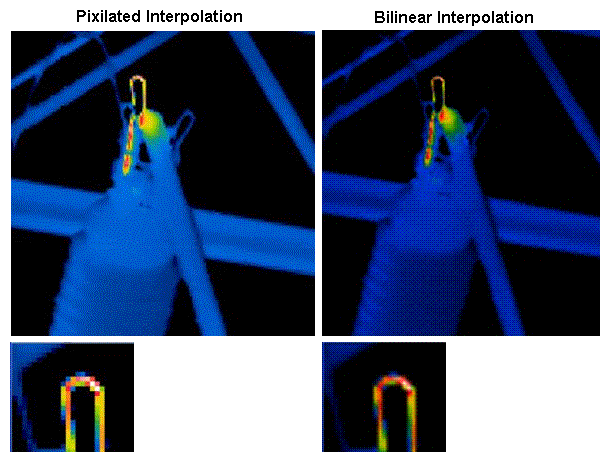
A digital infrared image is a two dimensional arrangement of pixel values based on the scene that the camera is viewing. If we were to zoom in on the pixels of an infrared image and look at a diagonal line or edge of an object we would see the appearance of a jagged edge. This is called “aliasing” due to the square nature of each pixel, which is the building block of the infrared image.
Resolution of the image is defined by two very different sets of numbers; in order to make accurate measurements, they must not be confused.
Set #1: The geometric, two dimensional resolutions of the overall footprint of the infrared detector (i.e., number of detectors/pixels in width vs. height).
Set # 2: The actual, instantaneous field of view (IFOV) of just one detector / pixel. The IFOV determines the actual degree of what can or cannot be imaged or measured correctly. In the case of many of the older scanning IR cameras we must consider what the height vs. the width of the single pixel is to establish a correct geometric ratio for the image to be spatially correct. (Note this must also be considered in the case of FPA as well but they have been typically 1:1 (height vs. width).
For the sake of this discussion we are only going to consider the geometric two dimensional resolution of the actual detector since it is that which determines the size of the images.
Let’s clarify what the geometric resolution is. First, we must establish what the actual (true) resolution of the infrared detector is, and what it is not. It is not the “interpolated” image resolution. For example, an IR image can be interpolated to make it look as if it were taken with a higher resolution IR camera. This is done mathematically by looking at each true pixel and all its adjacent (false) pixels and then averaging in what the influence of the false pixels would be if there had been an actual detector sensing the scene. These are false pixels because they don’t really exist in the scenes that an actual detector element truly saw. They are made up.
For example:
-
A camera that has a 160 x 120 detector provides an actual image of 19,200 pixels.
-
A camera that has a 320 x 240 detector provides an actual image of 76,800 pixels.
-
But a camera that has 160 x 120 detectors (19,200 true pixels) that interpolates the pixels to make it look like a 320 x 240 at 76,800 pixels is providing you with 57,600 pixels or 75% of the image that is not actually seen by the infrared detector!
Interpolated Images – Qualitative Thermography
The ability to interpolate infrared images is a fantastic tool when used correctly. It can greatly increase the qualitative appearance of the infrared image. It is important, however, that this not be confused with specifications on quantitative data that the actual IR detector sees. Interpolation can dramatically increase image quality and is a very valuable asset in its own right; it just must be used in the right place, at the right time, and in the right way.
For example, the first image is a “Pixilated” image that shows only one color value for each pixel.
Display Resolution vs. Detector Resolution?
One other area of confusion is placing the emphasis solely on the LCD display resolution and not on the actual detector. This is misleading the customer into thinking that they are getting more resolution than what the detector actually delivers.
What do Stefan-Boltzmann Laws, Planck, and Wien, have to do with the temperature measurement calibrations of your IR images?
One of the many things that you learn in a Level I Certification Course is that “heat transfer by radiation, as compared to condition, is not linear.” (The Stefan-Boltzmann law states that the total energy radiated j* per unit surface area of a black body in unit time (black-body irradiance) is directly proportional to the fourth power of its thermodynamic temperature T:
![]()
Or, for every time you double the temperature, you increase the amount of energy that is given off from the surface of the blackbody exponentially. The point here is that the amount of radiant energy between three different temperature measurement points is not linear, but follows a curve. This means that to make temperature measurements from an IR image, you must first understand the responsivity of the IR detector and the digitization of the output data so that the slope of the calibration curve can be established.
Note: Some detector outputs may take the calibration curve and linearize it (that is, make a linear approximation of the function), while others will not. It has been a common practice in the past to use a two point calibration method to try to establish the curve, but this method is not accurate on any detectors that are not linearized. There are many other factors that must be taken into consideration first. You must first determine the slope of the curve prior to linearization before you can calibrate it.
Planck Curves
Since the amount of energy that is emitted from an object increases with temperature, we can plot these curves with Planck formulae to establish the theoretical slope and shape of the curve for specific temperatures / wavelength. From this we can establish where the greatest amount of energy falls for a specific temperature / wavelengths. This helps to provide a better understanding of the slopes of the calibration curves that are used in establishing temperature measurements.
One cannot understand how to get temperature measurements out of an IR image without understanding and applying Stefan-Boltzmann and Planck.
Wien’s Law
Wien’s law plots the peak wavelength of energy for any given temperature along Planck’s curves and graphically illustrates that as the amount of energy increases for a specific temperature, the peak shifts from the cooler – longer wavelengths to the hotter – shorter wavelength region of the electromagnetic spectrum. The overall responsivity of the IR camera is based on what specific wavelength spectrum the camera operates in and greatly influences the slope of the calibration curves. For example, you can see that shortwave cameras have more sensitivity to very short wave reflectivity from high energy sources like the sun; as compared to long wave cameras which have more sensitivity to low energy reflections from cold or ambient objects in their direct proximity.
Radiometric Parameters for Accurate Temperature Measurement
In a radiometric image we must consider many of the parameters that influence the transfer of radiant energy if we are going to be able to determine the temperature of the object. (Not only energy transfer from the object, but also from the atmospheric window through which we are imaging, as well as any external optics. No camera can determine these parameters. The values must be put in by the thermographer to enable accurate measurements. Furthermore, many of the IR cameras on the market today do not actually accept all of the required input for the radiometric parameters that can and do influence the accuracy of your temperature measurements. In other cases, these parameters may not be stored in the image files and therefore, the later opportunities to take these parameters into further consideration will be forever lost. The critical radiometric parameters to determine are:
Some of these values can apply to the entire image. Other values should definitely be applied to each individual pixel if we are going to be doing our job correctly, especially the first (and most important) two values listed above. You may be surprised to learn that in all the major camera manufacturers proprietary file formats, emissivity and background reflected ambient energy is NOT applied to each true pixel.
Here is an example:
1. Emissivity. You can have an image where the emissivity can vary greatly from one pixel to the next because of the geometric shape and orientation of the object to the camera, as well as differences in the surface condition.
2. Background reflected ambient energy can influence dramatically the accuracy of temperature measurements depending on how low the effective emissivity of the object is, and the amount of energy that is reflecting off of the surface (both high energy and low energy reflections).
What most people do not realize is that the camera manufacturers have applied emissivity only as a value to the whole image, not to the individual pixel. Furthermore, the manufacturers have used the temperature of the atmospheric window through which the object is being viewed as the ambient temperature. This is incorrect. The correct measurement for ambient temperature would be the background reflected ambient value off of the surface of the object. These erroneous values are used as a convenience, because many camera manufactures don’t include the radiometric parameter in their camera. If and when these parameters can be edited is only in the analysis software, and the value for these radiometric parameters do not actually get applied to the image pixel, but rather to the analysis tool that is used on the image.
None of the IR image file formats from the camera manufacturers that are being supported today allow for the ability to actually create an emissivity or background reflected ambient temperature value map, pixel by pixel for the image. Instead, shortcuts have been made in file formats using the ability to add the parameter values to the analysis tools (spots, lines and areas) instead of placing the values in the actual image file. For example:
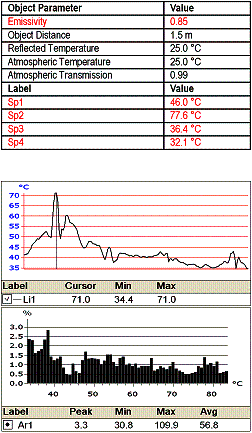 It is unfortunately common to observe a well-meaning, but inadequately trained person to move a spot meter around (flying spot meter) over an IR image while telling us assuredly what the temperature is of all the spots that the spot meter (pixel) covers. In actuality, each pixel could have a different emissivity and background reflected ambient temperature value.
Another example is drawing a line profile across an infrared image of a three phase circuit breaker. The line profile is drawn across all three of the wire lugs. A two dimensional graph (plot of the line as temperature across the wire lugs) is presented. But this is not correct, because of the differences in emissivity and reflection per pixel across the line profile that were not taken into account. What is actually being plotted in this example is the total radiance across the line as seen by the IR camera. Since the emissivity / reflectivity parameters for each pixel that the line is on in the image cannot be correctly accounted for, it is a misrepresentation of temperature.
Another problem is the use of histograms for areas which include a variety of the emissivity / reflection parameters. Again in this case, the histogram is not the correct representation of temperature but of the total radiance that the camera sees for that specific area.
This leads to the necessity to have the ability to set the emissivity / reflectivity parameters of specific pixels and regions in the image to specific emissivity / background reflected ambient temperatures values to be able to use these tools correctly on targets that have varying emissivity.
What Does All This Mean?
There is no such thing as a “point and shoot” IR camera that by itself will deliver accurate and reliable temperature measurements. Determining accurate temperature measurements is not easy, nor is it something that can be done without substantial training. There is a lot of science that goes into understanding how IR images are made to provide radiometric measurements. Each of the infrared detector manufacturers, as well as each camera manufacturer have their own “voodoo” in how they do it.
The Problem
As your camera becomes outdated, and/or manufacturers merge, and/or camera models become discontinued, all of your old images are driven to become obsolete, not because of their limitations, but because there is no way to upgrade the image files to a common standard file format that can be used across different camera platforms to archive your digital IR image data. Furthermore, you are limited in what you can purchase because you have made a considerable investment in the camera manufacturer’s software that only opens their image files. In the next few years we will see new camera manufacturers coming into the market with innovative technologies from which we could benefit, but we will have our shoelaces tied together because of our past buying history. And, as some manufacturers go out of business, we will see some image files no longer supported because there is no upgrade path for cross-platform image archiving. It literally amounts to taking all of the data that we have worked so hard for in the past and just throwing it all away.
The Good News
For over a year, an advanced development team comprising some of the sharpest minds in thermal imaging and software development from around the world have come together to establish a universal IR image file format called an “Infrared Digital Negative” file or *.IDN file to solve these problems. The team members are comprised of staff from:
|
|
The goal of the team has been to develop a program called “Thermal Trend – Image Analyzer” that is the “Adobe Photoshop of the infrared industry”. Thermal Trend – Image Analyzer provides for seamless integration with all of the Thermal Trend’s suite of software products, “Lean” a PdM Mobile database solution, and “Image Viewer” a utility program for the management of IR image files.
These goals include:
-
Open each of the different IR camera manufacturers proprietary image files, giving you access to all of the data
-
Allow you full control over all of the radiometric parameters of the image, and
-
Provide advanced analysis tools that will push your IR programs and services on to the next level
-
Key Benefit: The ability to establish a common Infrared Image File that allows for the upgrade of older file types to a solid, universal file format based on the leading technology of imaging handling
The Solution
The Infrared Digital Negative (*.IDN) file is a universal file format that will allow for an upgrade path for the digital archival of all infrared image formats in the same way that photographic negatives can be digitally archived. This Infrared Digital Negative File, i.e., “*.IDN” file is able to accommodate without limitation the upgrade of all existing infrared images:
-
All image sizes
-
All of the different dynamic ranges
-
All of the different calibration curves
-
All of the different metadata that are stored in the image
-
All of the additionally included data such as:
-
Visual images
-
Voice memos
-
Text comment
-
-
All of the analysis tools that were saved in the image file
Thermal Trend – Image Analyzerallows for the upgrade to:
-
Lossless image file compression
-
Emissivity and Reflective maps pixel-by-pixel
-
Additional object parameters that were not stored / accommodated in the older image file format
-
Additional image analysis tools stored into the image file and not the report software
-
Ability to customize the color pallets that are used
-
Ability to edit, or add additional text to the image file
-
Ability to edit or add voice/sound memos to the image file
-
Ability to embed photographic images into the image file
-
Full integration with Thermal Trend – Lean, database and Thermal Trend – Image Viewer, as well as standard Microsoft Office Products like Word, Excel, etc.
The *.IDN file is the “standard file format” for archiving digital infrared images across multiple IR cameras. “Archiving” your IR images is the most important action you can take in establishing an IR program that will last for years. Your images are your program; once they are lost…they are gone forever.
Fact: Today, IR manufacturers are dropping support for IR cameras that are just a few years old. Migrating your old images and data over to something that will work in the future is the best insurance available today to maintain the value your IR program. You worked hard to develop your IR program to where it is today; make sure it will be there whenever you need it.
For more information about becoming a member of the development team and Developers Kits for working with IDF files, please contact
For More information on Thermal Trend – Image Analyzer please go to www.ThermalTrend.com.
Lossless and Lossy Compression, a Whatis.com definition, Sept 30, 2004
Definition of Quantize by the Free Online Dictionary, Thesaurus, and Encyclopedia, Farlex Inc. 2005.
Stefan-Boltzman Law – Wikipedia, the free encyclopedia, 8 December 2005.
Advertisement


