PO Box 39 Burlington, NJ 08016 Ph: 609-386-12381 Fax: 609-387-4334www.jerseyir.com
Abstract
Process heaters are a critical component in the refining of crude oil. Similar in construction to a steam boiler, process heaters are used to heat crude oil by passing it through steel tubes located within the firebox of the furnace. Critical to the safe and efficient operation of the furnace is the operating temperature of tubes within the furnace. By using a thermal imager designed specifically for infrared inspections of operating heater tubes, it is possible to perform quantitative infrared inspections and monitor temperature of tubes within an operating furnace. This paper will discuss the application of thermography for process heater tubes and share insights from a project where thermographic monitoring was employed on a daily basis to help ensure safe operation of an operating crude furnace.
Background
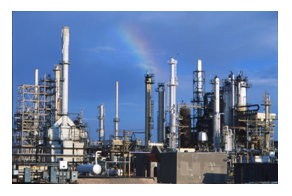
An oil refinery is a large, complex, and very specialized industrial site. Its purpose is to transform crude oil from its unprocessed state into various chemical products and byproducts. Common end materials from the refinery process include gasoline, heating oils, ingredients for plastics, and many other common products.
A typical refinery consists of a vast number of heaters, boilers, pipelines, processing towers, and machinery. Each section of a refinery fits into one of two functions: increase product yield or comply with emission and safety concerns.
In its unprocessed state, crude oil contains many impurities as well as hundreds of different types of hydrocarbons mixed together. After desalinization, the crude process heater is the beginning of the actual processing steps.
The first step in processing, the crude heater, heats the crude oil to allow different hydrocarbon products to be separated in the distillation column or fractioning tower. Each different hydrocarbon has specific chemical properties that allow them to be separated in the tower. The “lighter” products will rise higher in the distillation tower.
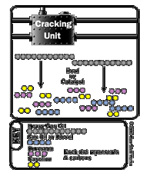
After the initial separation occurs, additional refining, cleaning and processing steps, known in the industry as cracking, are used to increase the yield of specific products and prepare the materials for use.
Some products, such as gasoline and heating oil, go to holding and/or shipping containers for end use. Other hydrocarbon materials will be sent to auxiliary sites for further processing or manufacturing use.
Infrared Survey of Crude Heater Tubes
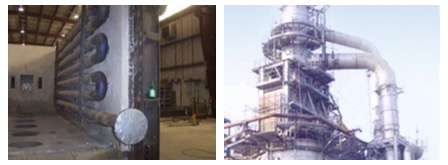
Crude heaters are constructed in many different designs, sizes, and shapes. All heaters consist of burners that provide the heat source; dampers and chimneys to provide draft and control the flame; and tubes to carry the crude oil through the heater. Access ports located in specific positions in the exterior of the heater are the viewing points available to perform infrared surveys. Two of the most common designs are bottle and box heaters.
Bottle heaters are cylindrical in shape and range from 10 to 40 feet in diameter. Tubes generally run vertically along the outside wall of the heater.
Box heaters, also known as cabin heaters, are rectangular and range in size. Generally they are at least as tall as they are wide. Tubes can run vertically or horizontally; be adjacent to the walls or in the middle of the box; and can be located on the walls, ceiling, and or floor. Although they require more space than a bottle heater, box heaters can handle a larger volume and/or more types of crude oil.
Tubes are designed to carry the crude oil. The chemical composition of the tubes is specific to the heater, its function, and the material that will be processed. This composition must be taken into account when performing an infrared survey.
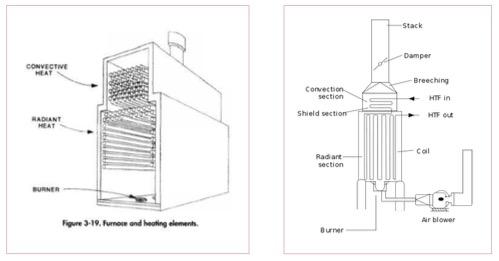
Tube diagram typical of a box heater – Tube diagram typical of a bottle heater
Several factors must be accounted for when performing an infrared survey of heater tubes. These variables include: emittance, reflected temperature, ambient temperature, distance to target, spot measurement size, and transmissivity of any external optics.
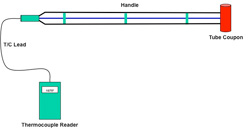
Schematic drawing of coupon
To obtain an accurate temperature, these variables must be identified and calculated for each specific heater, at the time of the survey. The preferred method is to utilize a “coupon”. A coupon consists of a piece of the same material as the tubes to be inspected with thermocouples mounted on the
back of the tube. When inserted into the furnace to a depth similar to the tubes to be inspected, variable factors can be identified and accounted for by using the data from the thermocouples.
Coupon installed in a heater
In many cases, a coupon is not available. In such cases, 100% accuracy of temperature readings cannot be guaranteed. The experience and training of the thermographer becomes most important.
Additional factors that cannot be controlled and may influence temperature readings include: viewing angle, presence of scaling on tube surfaces, changes in burner or flame patterns, pressure changes within the furnace, atmospheric (weather) changes, and different product materials or rate of flow.
Description of X7 Heater
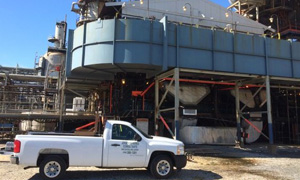
The crude heater named X7 is a primary crude oil heater in a petrochemical facility located in the mid-atlantic region. It is a vacuum box heater with chromium composite tubes running on the ceiling, floor and horizontally on two vertical walls. Burners are located on the remaining two walls. Normal operating temperature of the firebox ranges from 2200°F to 2500°F. Sight or viewing ports are located on the vertical walls that contain the burners. At this time, no coupon exists for this heater.
Initial Infrared Survey Project: Steam Air Decoke
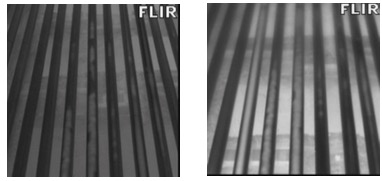
A common maintenance practice for heater tubes is steam air decoking. The purpose of the process is to use superheated steam, mixed with air, to remove or burn off unwanted debris, commonly referred to as coke, that builds up on the inside surfaces of the heater tubes. By controlling the temperature of the heater and the mix of steam and air, the coke located in the tubes flashes or burns off. The use of infrared thermography allows visual confirmation that the coke is removed as well as confirming that there is a uniform temperature pattern across all the tubes and that the temperatures are within acceptable ranges.
In early February 2013, Jersey Infrared Consultants was asked to perform an infrared survey of the X7 Heater during a planned steam air decoke. The estimated time frame for the full process was between 24 and 96 hours. Plans were made for continuous monitoring of the heater tubes during this process. After approximately eighteen hours site personnel halted the process and released our personnel.
In mid-March 2013, a baseline infrared survey for X7 Heater was requested. The initial report was that the heater had been back online for a short period of time when site personnel reported seeing a “red glow” on a couple of tubes.
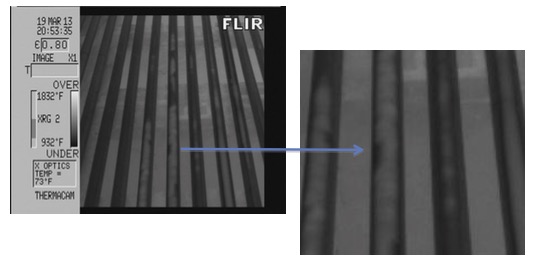
During the Infrared Survey, thermal anomalies consistent with coke patterns were identified in seven to eight heater tubes. Coke patterns are typically described as “half- moon” or “cigar” shapes. Additional concern was raised because the temperatures reported with the infrared imager were approximately 300 F° higher than the heater’s fixed thermocouples were reporting.
The infrared imager temperatures were above the heater’s critical threshold and the decision was made to monitor the heater continuously as operational changes were made. Adjustments to the rate of crude flow and the temperature of the burner flames lowered the tube temperatures to within acceptable limits. After about 26 hours, we were released from the site.
Within 24 hours of being released from the site, Jersey Infrared Consultants were asked to return to image the same heater. Areas previously identified as thermal anomalies were seen glowing during a visual inspection. Upon arrival, the initial infrared inspection identified that temperatures on several tubes were increased from the previous day and again above critical points. At this point, 24 hour, 7 day a week monitoring started.
During this short period of time, many issues arose. The following were the most concerning:
Additional thermal anomalies began to appear. Within a short period, thermal anomalies developed on fourteen tubes.
Wide and sometimes unpredictable swings in temperatures occurred. Tube temperatures ranged from 900°F to approaching 1200°F.
Control of the burner flames and temperatures was difficult. New burner tips with the correct length of supply pipe were installed, resulting in changes in burner response and flame impingement patterns.
Temperatures obtained using the infrared imager were consistently higher than the heater’s thermocouples.
Since accurate temperature measurements of the tubes directly influenced the amount of product that could be produced (facility profits), the life expectancy of the tubes, the safe operation of the heater, and the temperature differential caused the most discussion and concern.
Laboratory Test of Infrared Imager Temperatures
The question constantly asked was, “Why should the temperatures recorded with the infrared imager be believed instead of the temperatures reported by the thermocouples?” After many discussions, arrangements were made by the client to use a laboratory setting to confirm the temperatures recorded by the infrared imager.
In controlled conditions with a laboratory oven, a piece of material similar to the tubes was heated to approximately 1000°F. After entering the correct variable data, the temperatures obtained with the infrared imager were within 1% of the temperatures indicated by the laboratory equipment. This effectively proved that the temperatures recorded with the infrared imager were correct; and it was very possible that the thermocouples in the heater understated actual temperatures.
Jersey Infrared Consultants monitored the heater on a 24/7 schedule for approximately eight weeks. During this time several factors were identified that influenced tube temperatures. Addressing and/or controlling these factors led to improved control of the tube temperatures.
An increase in the amount of product flowing through the tubes decreased the tube temperatures. More crude oil flowing through the tubes allowed more heat to be absorbed, thereby reducing the temperature of the tubes.
A change in the type of crude (light versus heavy, for example) has a direct impact on the tube temperatures. Since the chemical composition differs between types of crude, the thermal properties of each type of crude are different; thereby allowing a different amount of heat to be absorbed by the product.
Tubes within the heater are zoned into specific tube runs. Increase and/or reduction of crude introduced to a specific run or combination of runs resulted in significant temperature changes.
A decrease in the output temperature of the heater’s burners by only a couple of degrees can have a significant impact on the tube temperatures.
Since X7 Heater is a vacuum heater, it is influenced by extreme weather conditions. Wind, changes in barometric pressure, and extreme external temperatures had a direct impact on the tube temperatures. Since these factors cannot be controlled, attention was given to the atmospheric conditions and thermographers expected to see temperature changes.
Burner tips recently installed were discovered to be too short, preventing the heat from being forced to the center of the heater box. The installation of longer burner tips relieved some of the heat directly hitting the tubes.
Control valves are used to regulate where and how much crude oil is allowed into the heater. The addition of more control valves allowed operations to have more control over how much crude was introduced to specific tube lines.
Petrochemical facilities commonly use high-pressure steam to control high temperatures. A steam lance was installed to help control the temperature of one area that routinely recorded high temperatures. Due to the configuration of this heater’s burners and tubes, additional steam lances could not be added.
At the end of eight weeks, tube temperatures stabilized to the point that monitoring was reduced to one shift per day. Although temperature fluctuations still occurred, confidence was high that corrective actions would result in the desired temperature adjustments, allowing the heater to remain in operation.
Installation of Heat Resistant Tiles
Regular monitoring and adjustments to the heater operation were controlling tube temperatures; however, new thermal anomalies continued to appear, normal operating temperatures were still creeping up, and production was limited by tube temperatures. The next plan was to devise a method to deflect the heat produced by the burners that was directly hitting the tubes.
Example of a single tile
One common industry solution to this problem is the use of heat resistant tiles. In a normal installation, the heater is taken offline, a support system is built and installed around the heater tubes, and heat resistant tiles are placed in the heater. The heater is then brought back online and production resumes.
Since a shutdown was not an option, plans were made to install the tiles while continuing to run crude oil through the heater. Large openings were made in the walls of the heater and specially designed blankets of heat resistant tile were slid into place on top of the tubes running on the floor of the heater. Since this operation was performed with the heater online, the tiles were placed directly on the tubes. The direct heat from the burners no longer made direct contact with the tubes.
The downside to this operation was that the infrared imager was not able to see through the tiles, resulting in limited access to the condition of the tubes. Designed spaces in the tiles, and areas of the tubes above and below the tiles were still monitored. Temperatures in these areas continued to fluctuate. In addition, the location and severity of the thermal anomalies located in the tubes on the heater floor continued to change.
Although the installation of the tiles did deflect direct heat from the floor tubes, continuous monitoring of the heater tubes was still required. Over a period of time the extreme and changing conditions required the addition of more tiles.
Conclusion
As with all applications of Infrared Thermography, thermal data collected at any given time cannot definitely predict if or when a failure will occur. This is absolutely true for heater tubes.
The current temperature ceiling for this heater tube project is 1490°F. If at any point a spot on a tube records a temperature greater than 1490°F, actions are taken in an effort to lower the temperature.
By continuous monitoring, the facility remains online and refining oil. Although the price of gasoline at the pump has dropped, reported profits for the company are calculated in the millions per day.
Advertisement
Latest Articles
Infrared Thermography in Marine Laminate Inspections: The Problem with Solar Loading

 An oil refinery is a large, complex, and very specialized industrial site. Its purpose is to transform crude oil from its unprocessed state into various chemical products and byproducts. Common end materials from the refinery process include gasoline, heating oils, ingredients for plastics, and many other common products.
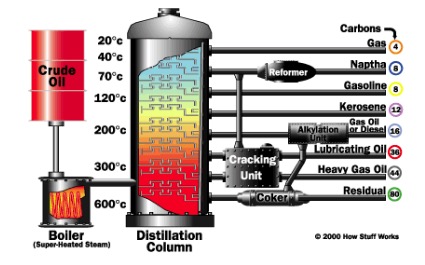
 After the initial separation occurs, additional refining, cleaning and processing steps, known in the industry as cracking, are used to increase the yield of specific products and prepare the materials for use.
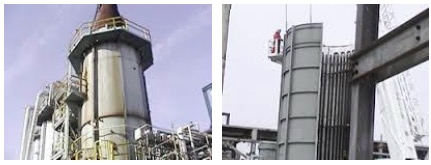

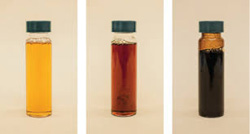 A change in the type of crude (light versus heavy, for example) has a direct impact on the tube temperatures. Since the chemical composition differs between types of crude, the thermal properties of each type of crude are different; thereby allowing a different amount of heat to be absorbed by the product.
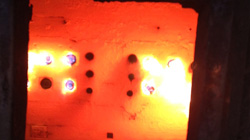 Burner tips recently installed were discovered to be too short, preventing the heat from being forced to the center of the heater box. The installation of longer burner tips relieved some of the heat directly hitting the tubes.
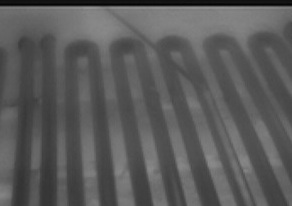 Petrochemical facilities commonly use high-pressure steam to control high temperatures. A steam lance was installed to help control the temperature of one area that routinely recorded high temperatures. Due to the configuration of this heater’s burners and tubes, additional steam lances could not be added.
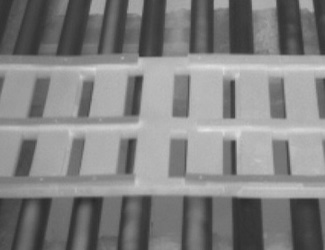
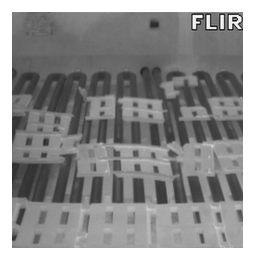 blankets of heat resistant tile were slid into place on top of the tubes running on the floor of the heater. Since this operation was performed with the heater online, the tiles were placed directly on the tubes. The direct heat from the burners no longer made direct contact with the tubes.
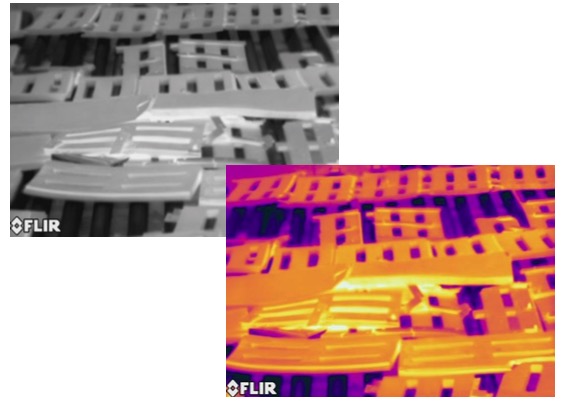
 The current temperature ceiling for this heater tube project is 1490°F. If at any point a spot on a tube records a temperature greater than 1490°F, actions are taken in an effort to lower the temperature.