Case Study of a Hotel Missing Insulation
Tom Mayfield
CIRT, CIAQT
Mayfield Thermography Consulting Services, Inc.
1805 Glengarry Drive
Carrollton, Texas 75006
Ph: 972-323-0058
Abstract
The management at a brand-new, four-star Texas hotel received so many complaints about the noise from adjoining rooms that they hired an acoustical engineer to find the problem. The engineer was able to tell them that they had a problem with missing insulation, but could not determine where the insulation was missing.
Our firm was hired to locate the areas where insulation was missing so that repairs could be made under warranty by the general contractor. This paper describes the methodology developed and shows the results of that testing.
Discussion
The Problem
A four-star Texas hotel opens its doors to the public. The customers quickly respond to noise problems from room to room…after all, who wants to pay $200+ for a nice room and then have to share your conversations with the neighbors as if they were in your room. After four months of noise complaints, the management decided an investigation needed to be launched to solve the problem.
At that point, the hotel contacted an acoustical engineer to perform some STC (Sound Transmission Class) testing. STC is a single number quantifier used to rate partitions, doors and windows for their effectiveness in blocking sound. This whole process is based on a standardized procedure defined in ASTM E90 for laboratories and E336 for field tests in actual buildings; while the STC curve is defined in ASTM E413. In practice, the STC of the laboratory sample represents the optimum condition and is rarely achieved in actual construction. The difference between the actual and field STC is a result of leaks and flanking paths. In other words, sound entering a wall in a common assembly is also entering the floor, traveling through the floor, and breaking out in the adjoining space, therefore by-passing the wall. A similar effect is found if sound is allowed to enter air return plenum spaces above, below, or through the walls. The degree to which these flanking paths are disconnected will determine how closely the field test results approach the laboratory results. Table 1, below, defines the various STC levels that acoustical engineers use.
| STC Lab | STC Field | Subjective Description of Effectiveness |
| 26-30 | 20-22 | Most sentences clearly understood |
| 30-35 | 25-27 | Many phrases and some sentences understood without straining to hear |
| 35-40 | 30-32 | Individual words and occasional phrases clearly heard and understood |
| 42-45 | 42-45 | Medium loud speech clearly audible, occasional words understood |
| 47-50 | 40-42 | Loud speech audible, music easily heard |
| 52-55 | 45-47 | Loud speech audible by straining to hear; music normally can be heard and may be disturbing |
| 57-60 | 50-52 | Loud speech essentially inaudible; music can be heard faintly but bass notes disturbing |
| 62-65 | 55 | Music heard faintly, bass notes “thump”; power woodworking equipment clearly audible |
| 70 | 60 | Music still heard very faintly if played loud |
| 75+ | 65+ | Effectively blocks most airborne noise sources |
| Table 1. Subjective interpretation of effects of STC as measured (assumes normal/quiet background level – NC 35) | ||
Notes for Table 1:
• The level noted in Red is the approximate level causing noise complaints at this hotel
• The level noted in Blue is the normal/quiet background level of STC 35
• The level noted in Green is the required STC 50 level for current building construction
• Changes in the National Building Code 1990 now require that partitions separating dwelling units meet an STC 50 requirement and the building code provides sample ratings for several types of wall constructions
The acoustical engineer could quantify that there were indeed major problems, but could not point to the exact locations causing the problems. Fortunately, the acoustical engineer knew about infrared thermography and knew about my company, so he suggested that the hotel contract us to perform a feasibility study to see if infrared could define and quantify the problems. The thermogram below (Figure 1) represents what we found in the first room that we surveyed. After they saw the results of the feasibility study, they decided infrared thermography was THE way to quantify the missing insulation problems.
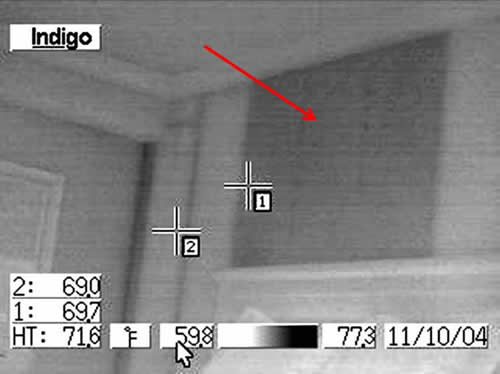
Figure 1. Thermogram showing missing insulation
The IR Project
How do you infrared survey 1600 guest rooms in a hotel in full operation with an occupancy rate between 30% and 100% with an average occupancy rate around 80%? The obvious answer is one room at a time, but the hotel wanted a plan. We first attempted to deal with the many rooms that had the most noise complaints, but they were spread out and we needed at least three contiguous rooms at the same time; the noisy room, and the rooms on either side (more about this below). As it turns out, this was inefficient as we found ourselves bouncing around the hotel like ping pong balls, walking 5-8 miles a day, instead of IR surveying. My suggestion was to wait instead of walk. We waited for those times when their occupancy rate was 50% or lower and then took 100 or more rooms out of service at once in one area and on one floor. We would go in 24 hours before the IR survey and heat every other room, so that the result was alternating hot and cold rooms (hot – cold – hot – cold). That way, the adjacent rooms always had a 15-20 degree Delta-T in ambient temperature. As we proceeded, anomalies were documented and reports were generated on the rooms surveyed during each session. The data collection was accomplished with an assistant who entered the textual data as the thermographer dictated the findings one wall at a time. We established a set procedure for scanning (always left to right) and a set procedure for data entry (see Table 2). We also used the same terminology to identify each of the walls and objects in each room. To lessen confusion and always make the anomalies colder than the rest of the wall, the polarity was reversed if necessary.

Table 2. Spreadsheet of example data contained in thermographic reports
By the time we finished scanning a section of rooms, the report text was basically complete. To prepare the reports, all we had to do was proofread the text and do the image post-processing, which consisted of adjusting the brightness and contrast and inserting each thermogram into the appropriate spot on the report page. By converting the file into a secure PDF, only printing could be performed on the document once we turned in the report.
The Results
The rooms averaged a failure rate of 85%, meaning 85% of the rooms surveyed had at least one problem requiring repair (see Figures 2, 3, 4, & 5). The problems ranged from missing insulation to moisture issues (mostly from overflowing bath tubs) and a few condensation problems.
Figure 3. Thermogram showing missing insulation in partition wall
Figure 4. Raw thermogram showing installation of a 16” batt (yellow arrow)
in a 24” stud space (white arrow)
Figure 5. Thermogram showing evidence of an uninsulated pipe chase on a bathroom wall.
Inset is a photograph taken after IR testing
The Fix
The GC was definitely responsible for not meeting the specifications and for making the repairs. The hotel had proof positive of the deficiencies, and because all the walls were documented, they knew exactly where the repairs had to be made. After each report was submitted, the general contractor was required to schedule complete repairs on the same block of rooms which were taken out of service for the IR testing. This was a two day process for each room as they would remove the sheetrock, replace the missing insulation, and repair the sheetrock on the first day. On the second day, they would finish the sheetrock, and paint or wallpaper the repaired areas. In order to help the acoustical issues, the repairmen also air-sealed the rooms during this process. They were only able to accomplish this for 100 or 200 rooms at a time owing to large repair crews of between 50 and 100 workers.
Summary
This was a very successful project and an example of how well IR can work as a quality-assurance tool for buildings.
Advertisement
