Scott Cawlfield, President
Logos Computer Solutions, Inc.
3801 14th Avenue WestSeattle, WA 98119206-217-0577www.LogosComputer.com
&
Neal MacNamara,
Corporate PdM Coordinator
Southern Nuclear Company
Introduction

Race cars are expensive, highly specialized, very fast automobiles that run efficiently and effectively when properly used and maintained. The high performance race car can go 200 mph using all of the gears, but when you only use first gear, it will top out at 60mph. It also won’t last as long as expected and is very expensive (poor ROI) when not used properly. The same goes for your Predictive Maintenance programs – when properly used and maintained, they can be extremely effective.
Discussion
What does this mean for your PdM program? What are the parts of the PdM program; how do they affect the overall corporate goals and strategy? Where does infrared fit into the picture? What are some of the lessons learned through this case study? What are some ways to optimize your PdM program’s effectiveness? The data shown in this paper come from a variety of sources and the names have been removed to protect the innocent.
First of all, management buy in, understanding, and support are critical, but this point will not be covered in this paper. Secondly, what has happened in the past is important in comparing your program’s effectiveness and to set future goals. Third, company operational goals to measure your success are essential, but not always required, with respect to your PdM program moving forward, but they are highly recommended. Without a goal, it is hard to measure your progress, but you can do some internal measurements without company operational goals. Fourth, how do you integrate and communicate between your different islands of PdM data to get an overall asset health picture? This is critical to using all your informational resources just like it is important to use all the gears on your race car. Fifth, how do you communicate your current and overall status to management, who will be the ultimate judge of the success of the program and whether it should receive continued funding?
The Past
Before starting your PdM program, it is good to arm yourself with the past history of one of your company’s key performance indicators (KPI). This can usually be found in your CMMS data like Maximo or SAP. For example, here are the past 4 years of Equipment Forced Outage Rate (EFOR) before the integrated PdM program was implemented.
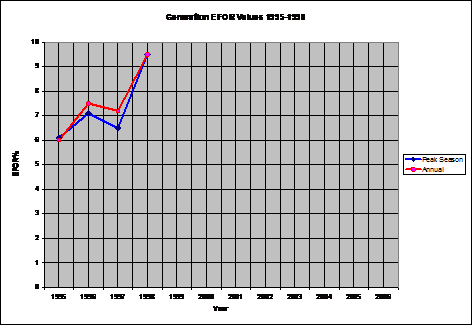
Given the EFOR rate is between 6% and 9.5% and rising, this is a good time to see if implementing a Predictive Maintenance Program will directly impact this key performance indicator. Also, several other goals like the ones below can be set out to gauge the overall success of the PdM program.
Sample Operational Goals
1. Reliability
The objective of these goals is high plant reliability and excellent outage performance
2. Unplanned Capability Loss Factor (UCLF) – (10%)
Must maintain a fleet UCLF at or below 2.50%
3. Annual Capability Factor – (20%)
Must maintain an annual fleet capability factor of 90.0%
4. Cost
To reflect the impact of cost management on the company’s earnings for the current year, the company’s Cost Performance is defined as a short-term goal category comprising:
O&M/A&G Cost Variance – (10%)
Manage expenditures to a budget of $500M (including all expenses, but not including capital or fuel expenditures)
It is good to have several goals, since some key performance indicators can be affected by outside events that you have no control over. See below.
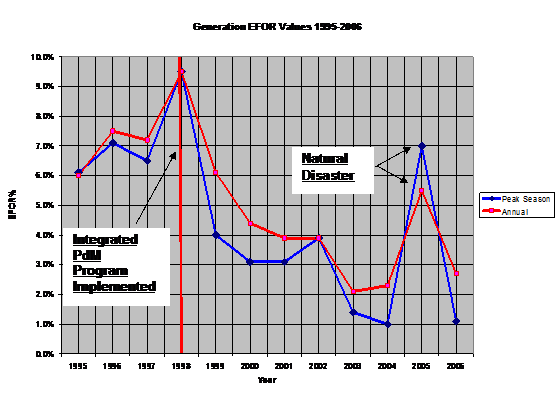
As the graph shows, a significant improvement was seen in the EFOR values after implementing an integrated PdM program. Even though this KPI was adversely affected by a natural disaster, the EFOR values returned back to 1.1% in 2006 which is excellent progress compared to 9.5% in 1998. It also exceeded the original goals set out for the company as a whole.
How does PdM fit into your overall maintenance program? Here is an example of a company and what an “ideal” or “best practice” percentage would be.
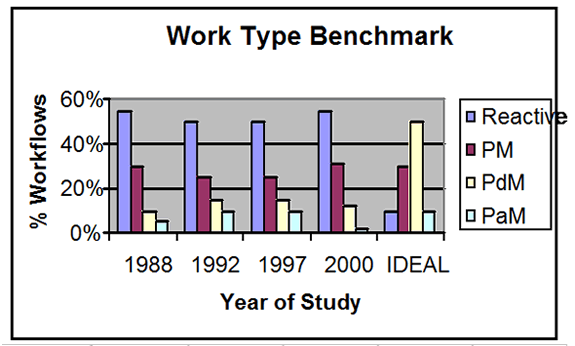
As you can see, reactive and preventive maintenance takes up 75% to 85% of this company’s resources, and predictive maintenance is only about 10%. This is a typical fire fighting approach and costs the company a lot of money. Ideally, PdM tasks should be around 50% and Reactive tasks should be down to 10%. This best practice target will also reduce your total overall maintenance costs while improving uptime and reliability.
Below is a graph of how much a failure costs depending on when it is found.
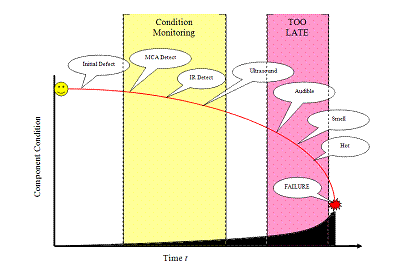
An early find is easier to fix and the cost is minimal compared to the late find when you walk by a motor and hear the motor squealing and smell something burning. By then it is usually too late and the motor needs to be replaced instead of repaired and at a much higher cost.
Where Do I Get the Resources?
Predictive maintenance can usually find problems before they are very costly to repair or replace. Many program managers know this but find they don’t have the budget or resources to implement a good PdM program. Don’t let this be a roadblock to implementing your PdM program.

Roadblock
The first place to look is to review and optimize the Preventive Maintenance (PM) program. Many times, PM work orders are not as effective as they were originally planned out. Below is a study of the effectiveness of a company’s PM program. These are rough averages and each company will have a different mix, but it is a good example to learn from.
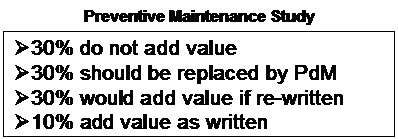
As we can see, 30% should be removed completely. Another 30% should be replaced by PdM’s, but where do you find the money to create and buy the PdM technologies? Take a look at the some of the costs of your PM’s. Below is a cost average for PM’s in 2003 for 9,512 work orders.
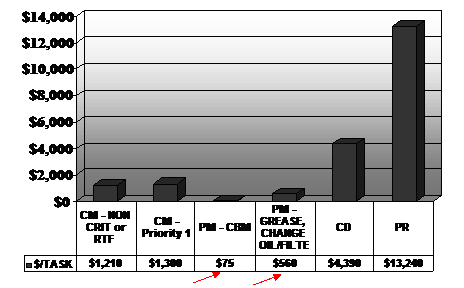
Notice that PdM (PM-CBM) costs on average are $75 per task vs. $560 for a PM task.
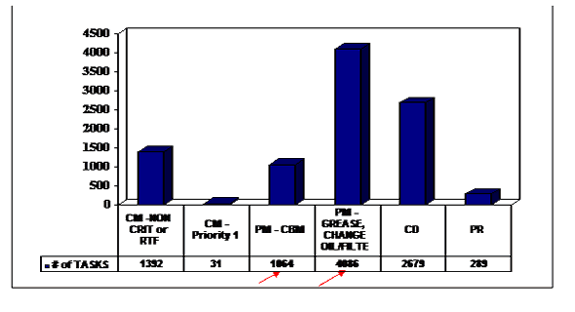
Multiply these cost averages by the number of PdM’s of 1064 and PM’s of 4086 and you get this cost chart below.
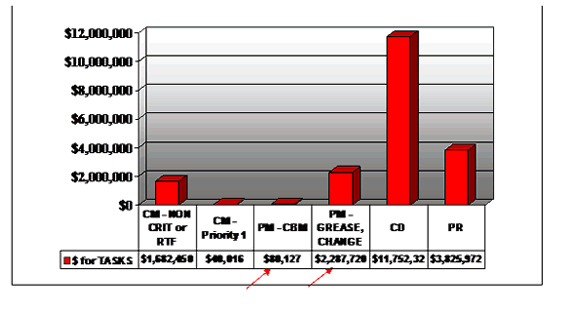
In this example, roughly 60% of the $2,287,720 cost could be simply removed or replaced by PdM tasks. 60% is roughly $1,300,000, so taking a conservative approach, around $1,000,000 might be freed up to invest in new PdM technologies.
PdM Implementation
`
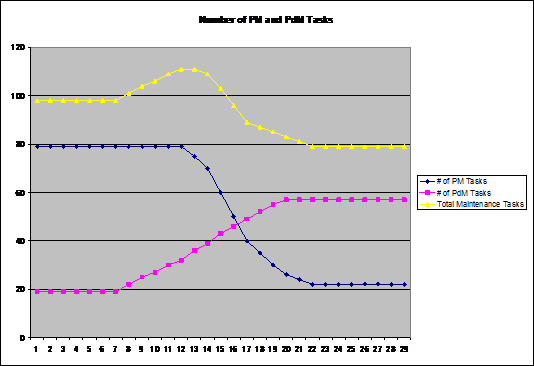
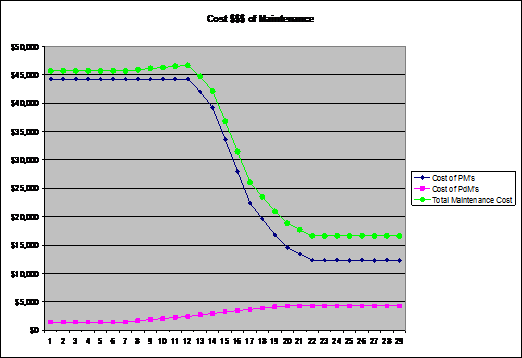
As the above graph shows, when moving PM tasks over to PdM tasks, your overall number of tasks and costs may increase temporarily. However, over the long run, there should be fewer tasks and less overall costs, as shown in the next graph.
Here are some program summary data from 2002 to 2005 and the associated cost savings from the selected cases. This shows conservatively $609,831 of cost savings directly off the bottom line of the O&M budget.

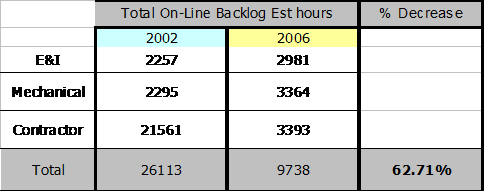
As for manpower, here are results of some resource utilization improvements from 2002 to 2006.
Integrated PdM Data and Communicating the Results
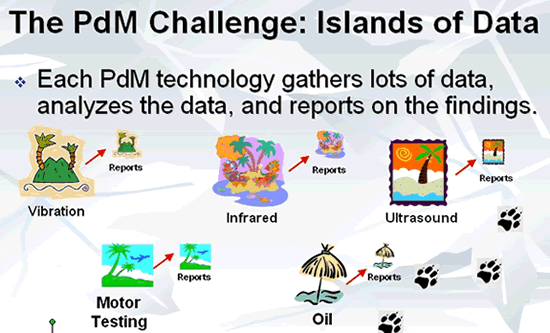
Once you have management buy in, you have bought the technologies: vibration, infrared, ultrasound, motor testing and oil, and you start your inspections, you will find another challenge: “Islands of Data”. Also, where does infrared fit into this “islands of data” picture? Now that you shifted into second gear in your PdM program, you will find every technology has its own program and database for collecting the data and reports, but they don’t talk to each other. Management wants to know what the results of the money spent on PdM technologies are, and they want to know what the health of all their assets in the plant is. This could be requested on a weekly, monthly, quarterly, or annual basis.
As you can see above, infrared is just one of the many technologies in this corporate PdM program structure and the usual way to summarize the data into useful information for management is shown below.
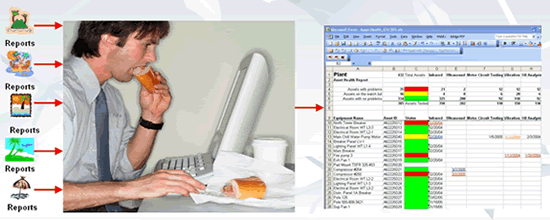
Manual data entry into Excel is one way to summarize the data into an overview of your plant’s asset health. This is time consuming, boring, and prone to errors, but it is one way to create an integrated asset health report. The key is to be able to view all your assets and all your PdM technologies testing those assets in one decision-support control panel. Now data can be analyzed, the PdM program optimized, and key performance indicators can be reviewed.
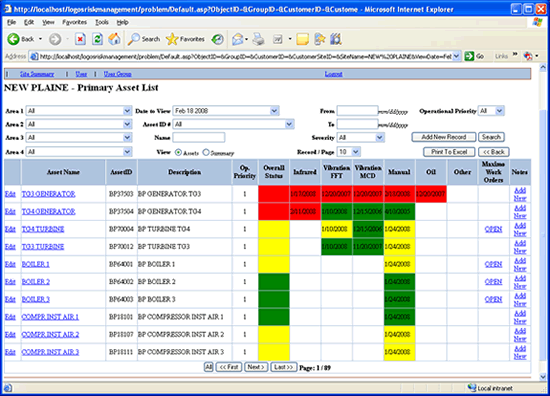
Once it is all combined electronically, it can be shared and reviewed by all the PdM technicians. This brings all your predictive maintenance personnel knowledge and expertise into one place so informed decisions can be made quickly. This shifts your program into third gear. The final part of communicating the PdM results is to the management in some higher level systems for a broad corporate overview.
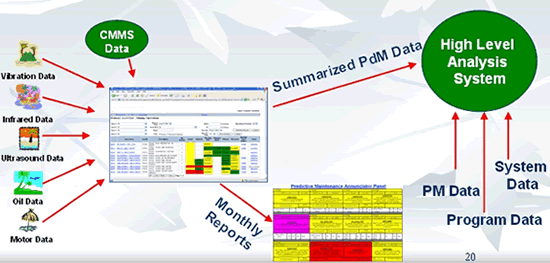
Turning technology data into useful electronic information is the key to maximizing your PdM program results. Easily viewable electronic information for analysis and reporting is essential for management to see what the PdM program is achieving. Management must see the PdM program as an integral part in achieving your company goals. When they see the PdM results on a regular basis, they will likely continue to support the program with funding.

This final communication task will help shift your PdM program into fourth gear and maximize your return on investment (ROI) for your whole company.

Visit out Sponsors:
Electrophysics


