Michael R. Montgomery
Level III Certified Infrared Thermographer
Delphi Electronics & Safety
2033 East BoulevardKokomo, IN 46904Ph: 765-451-1202www.delphi.com
Abstract
Electronics are critical components in modern motor vehicles. From engine and power train controls to storage batteries for hybrid vehicles, electronic components are an integral part of several diverse systems. Proper manufacture of automotive electronics is critical to both safety and reliability of a vehicle. This paper will discuss the use of infrared thermography as predictive maintenance tool in an automotive electronics manufacturing facility. This paper will also include how thermography is used in research and development of new products and manufacturing processes.
The Infrared Predictive Technologies Department
Infrared thermography is possibly the most versatile of the predictive equipment available in the department. One example would be the variety of applications that are common to some of the other predictive tools such as checking for overheated bearings, faulty steam traps, and misaligned motor couplings, etc.
Predictive Equipment used in our department:
- Laser Motor Shaft Alignment (Fixtur Laser)
- Laser Pulley Alignment (Fixtur Laser)
- High Speed Video (Olympus)
- Ultrasound Leak Detection (UltraProbe)
- Motor Vibration Analysis (Emerson)
- Infrared Thermography (Flir 595)
These cost saving technologies have earned a role in our efficiently run Automotive Electronics Manufacturing Facility Maintenance Department.
These applications are used in conjunction with many facets of the entire Manufacturing and Engineering campus including:
- Facilities Maintenance
- Engineering Support
- Production
- Product Development
- Energy Reduction
Maintenance Supervisors, Electricians, Pipefitters, Millwrights, Machine Repairmen, Tinsmiths, R&D Engineers, Equipment Engineers, Facilities Engineers, Machine Vendors, and Production Supervisors are among the most frequent requestors for the infrared camera. The infrared camera is the most requested application of the Predictive Department.
Predictive Technology Uses for the Infrared Camera
- Predictive/Preventative Maintenance Program
- Creating Baseline Thermal images for new equipment or after replacing or repairing equipment parts, such as motors, heater elements, relays, etc.
- Structural energy losses, such as roof top A/C units, exhaust fans reportedly not in service, steam valves stuck open on air handling units in cooling cycle; leakage of heat, water, and air.
- Troubleshooting Problems. (electrical, mechanical, production, product development, engineering, facilities, etc.)
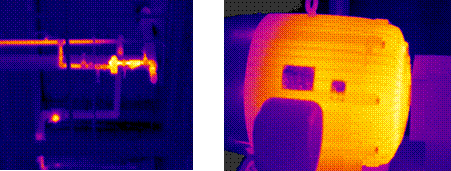
- Electrical Power Distribution. Scanning high voltage supply lines, switchgear, armored cable, splice boxes, etc. for anomalies.
 |
 |
| Baseline Image | Bus Duct Switch |
Predictive/ Preventative Maintenance Schedules
All of these situations are related to thermal energy being released or not being released. Some calls are made with a sense of urgency, so they turn into a “hot” job. Being able to help solve a critical situation is one of the satisfactions of my job. Helping solve critical problems with a thermal imager builds trust among fellow workers. They are more inclined to call our office to try new and faster ways to solve their problems through thermal imaging. Supervisors, Tradesmen, and Engineers, want to know if infrared Predictive PMs or PDMs, as they are named at our facility, can be added to their equipment. Machine uptime is critical to Production schedules. When working with slim profit margins, the added cost of Production equipment being down due to mechanical or facility problems can be extreme. There can also be extra shipping costs to make a shipment schedule or a costly penalty for not being on time with delivery.
The PDMs are scheduled through a computer program called Maximo. The Preventative Maintenance schedules or PMs are also in this program. All PDMs are assigned different lengths of weekly intervals depending on the equipment and the amount of use it may receive. Some PDMs are set for 8 weeks, some for 24 weeks, and others for 48 weeks. Our facility’s equipment has to be adjusted to times and temperatures of the seasons. For instance, air handling units should be IR scanned under full load, in the heat of summer. We try to scan these units when the temperatures are above 88 degrees. Cooling tower pumps are not turned on until the outside temperature reaches 58 degrees or higher and these usually cannot be IR scanned until May.
There are variables to PDM schedules, but the jobs are generated weekly, each Monday morning.
A job is assigned to a Predictive tradesman and put on the Maximo screen. We then proceed to the job and perform our Predictive procedure.
 |
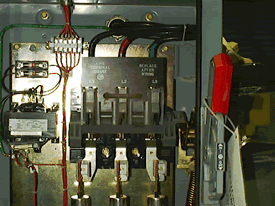 |
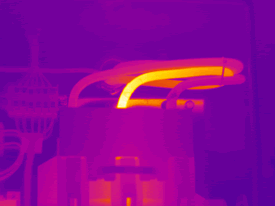
| Chill Water Pump | Disconnect / Starter |
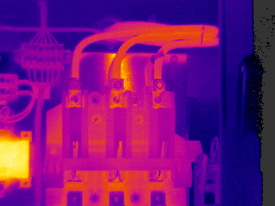
In this case, an anomaly has been found with the infrared camera. The infrared picture is recorded and a still photograph of the location of the anomaly is taken. A report is made and given to the Supervisor of the area where the potential problem was found. The Supervisor gives the report to the Electricians in the area for further investigation.
The Predictive tradesman opens the Maximo program and inputs a job called PM follow-up or PMF. The job fields are filled out from the PDM that was generated. A message is added to the PMF and the job is posted on the Maximo screen. This enables an area Electrician to be assigned on the Maximo screen to the PDM where a potential problem has been found. Thus, any follow-up work from PDMs can be tracked by the Maximo program. This includes the amount of time taken to complete the PMF, and any messages the area Electrician may record.
Once the PMF job is completed, the Predictive tradesman conducts another thermal inspection of the anomaly. A follow-up report is generated and given to the area Supervisor. This procedure is continued until the anomaly is no longer present.
 |
 |
| Chill Water Pump | Disconnect / Starter |
We are constantly monitoring new Production lines, facilities, and any other areas that need to be documented with new PDMs. Equipment ID numbers, machine specifications, locations, and the different predictive technologies must be added to the PDMs. Again, the amount of weeks between PDMs must be determined for each piece of equipment.
We are constantly monitoring new Production lines, facilities, and any other areas that need to be documented with new PDMs. Equipment ID numbers, machine specifications, locations, and the different predictive technologies must be added to the PDMs. Again, the amount of weeks between PDMs must be determined for each piece of equipment.
There are several factors involved in that determination:
- Type of Equipment (solder pot, reflow oven, motor control center, air handling unit, motor starter, etc.)
- Amount of usage. (Is it used for all three shifts? How often is it used per shift?)
- Type of use. (Is it Production or Facilities equipment?)
- The type of PDM (Infrared, Ultrasound, or Motor Vibration Analysis)
All this is recorded by Predictive personnel, put into Excel spreadsheets and given to the Maximo Administrator to input into the Maximo server.
The Administrator is very important to the success of the Predictive Department. He is our interpreter and generates weekly PDMs, and he has the ability to change or delay the dates that the PDMs are generated on.
PDMs have the ability to find a potential problem before it has the opportunity to occur. During the scheduled weekly Preventive Maintenance on the equipment, sometimes a problem is found and sometimes a potential problem is undetected.
Routine maintenance is performed and readily apparent problems are often sighted. Predictive PMs unlock secrets to equipment that only a Predictive tool can expose.
Case Study of a Predictive PM Anomaly and the Potential Cost Avoidance
One prime example of PDM productivity occurred in late July and early August of 2007. Over 100 roof top HVAC and air handling units were due for infrared PDMs. I recall the temperature being in the nineties. Working before noon every day, with an assistant and a sheet of cardboard to block the sun when necessary, we were able to find many anomalies. We found loose main fuse connections, loose breaker connections, loose contactor connections, bad relays, and loose lugs.
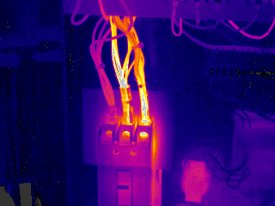
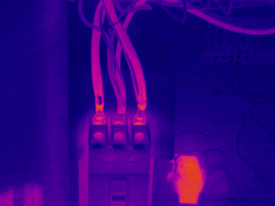
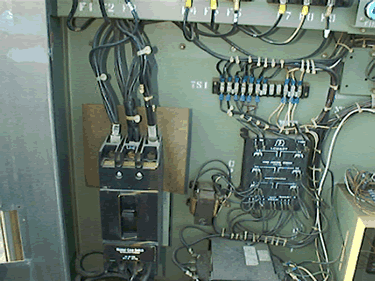
Two of these anomalies were a loose connection and bad lug in the second phase and a loose connection in the third phase of the main breaker of an HVAC unit. This unit maintained a temperature of 68 degrees F in one of our Production departments. That temperature has to be constant to allow the ink paste in our Substrate Assembly lines to flow with the right consistency. The potential failure of the main breaker could have caused the HVAC unit to fail and therefore raise the temperature in the ink paste machine zone. This would have shut down all Substrate Assembly Production in that department.
 |
 |
 |
|
|
HVAC Main Circuit Breaker |
|
The main breaker anomaly was repaired and another thermographic image was taken. The image showed no apparent anomaly.
Cost Avoidance of the HVAC Anomaly
We were able to obtain a general cost avoidance amount by using these different factors:
- Costs of Maintenance workers to make repairs. (Hourly costs and materials costs)
- Lost Production time
- Possible premium shipping costs to make on time deliveries
- Possible vendor penalties for late delivery of product
- Costs of idle production and Production Maintenance workers while repairs are made
From these factors, Production Management for the Department quoted these potential costs:
- Over a million dollars for a five day period of downtime. This quote only pertained to the most important production line
- This did not include Maintenance repair costs, overtime for catastrophic conditions, or actual material repair costs
The Infrared Camera as a Troubleshooting Tool
 |
 |
|
800 Amp Bus Duct Switch |
Chill Water Tower Fan Motor |
Another side of the Predictive Technology job is the walk-in or call-in job. This is when the infrared camera can be used as a troubleshooting tool.
We have had calls from Facilities, Engineering, Production, and Product Development Engineering. We always try to put our jobs in an order of priority. The first priority is keeping Production rolling.
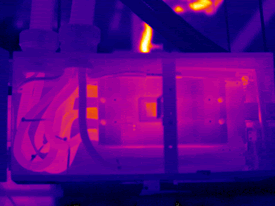
Facilities can also be a top priority, if it is or will be affecting Production. Such as an 800 amp bus switch tripping out and shutting down production in our Integrated Circuit Silicone Wafer Fabrication facility.
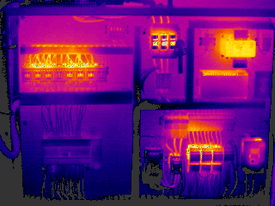
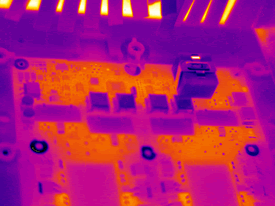
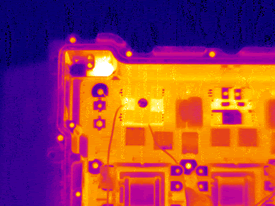
Engineering may have problems with circuit boards that are used in the assembly of a finished product or circuit boards used in Production equipment.
 |
 |
|
Infrared images used for troubleshooting circuit board |
|
Belt Eating Exhaust Fan Dilemma
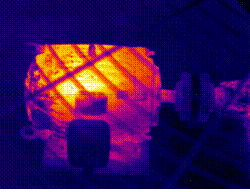
An exhaust fan assembly had started shredding belts every 8 to 10 days. It had happened twice in the previous 3 weeks. The failures affected Production output because this exhaust fan was ducted into several pieces of critical equipment. When the belts broke, production was stopped.
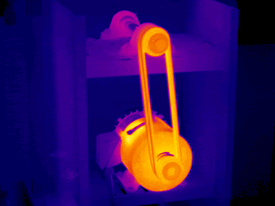
The Facilities Millwright for that area was familiar with our infrared thermography work. The Millwright stated the pillow block bearings were hot to the touch.
He asked if I could shoot the two-pulley fan assembly after the old belts were replaced. The infrared images revealed belts, pulleys, pillow block bearings and a motor that was apparently very warm.
We took infrared images from similar size exhaust fan assemblies. The other assemblies appeared considerably cooler.
After Production was finished for the day, the Millwright and I aligned the pulleys with our laser belt alignment tool and he put the new belts on the pulleys. After the fan ran for a while, I took more infrared images of the assembly. I found little difference in apparent temperature of the components. The next day we contacted the Senior Facilities Plant Engineer for his advice. He took air movement readings at each piece of equipment that this exhaust fan was tied into. The results showed the fan was pulling more air than what was needed. The Facilities Electrician stated that this fan had been tripping breakers and blowing fuses. I measured the current with an Ampere meter. The motor was drawing 8.3 amperes at 480 volts.
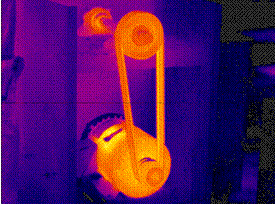
Using a power transmission program, our Engineer determined the pulleys or sheaves were the wrong size. The current sheaves were too small and not a matched set. This sped up the fan and caused all the problems. The correct sheaves and belts were ordered. A larger driven sheave replaced a smaller sheave. The fan assembly now runs more efficiently.
The apparent temperatures were lowered by 50%. The motor current dropped from 8.3 amps to 3.6 amps and the energy usage was reduced by 53%. The electrical cost savings for this fan is $1,744 a year. The infrared images show a much cooler motor, belts, sheaves, and pillow block bearings.
 |
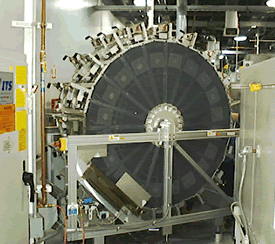 |
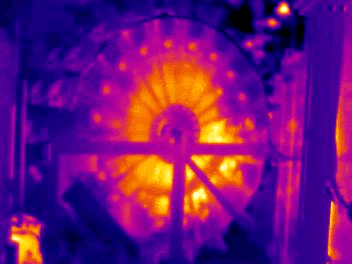
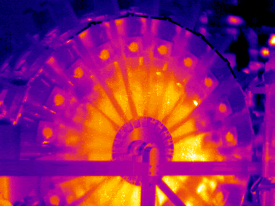
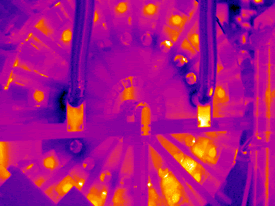
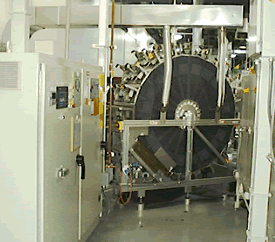
Product Conditioning Tester Wheel
This situation involved a product conditioning tester. The tester wheel is loaded with two products at a time, and is rotated up to load again. The tester simulates real condition power loads. The conditioner had a perforated covered side and a Plexiglas side when it was first installed. When the individual power conditioning units in the wheel began to fail due to too much heat in the interior, six inch muffin fans were added to both sides. The fans on the perforated side exhausted warm air; the fans on the other side drew in outside air. Later, the Plexiglas side was drilled with 1/4 inch holes for more air circulation. This dissipated some of the heat, but not enough of it. The power conditioning units were still failing, but at a slower rate.
The Maintenance Supervisor asked if we could get a thermographic image of the conditioning wheels. They wanted to see where the thermal energy or “heat” was concentrated. The image showed how many fans were still working and how the power conditioning units ramped up with energy as the testing wheel was rotated. Some thermal images were taken of these testing wheels for an Engineer assigned to this project. The latest solution was to use a portable A/C unit and duct the cooled air into the perforated side of the unit. The thermographic images show less thermal energy in the wheel since the A/C unit was ducted into the testing wheel. Holes were drilled to match the size of the A/C ductwork. Although I don’t have any statistical data for the failure rate, the Tradesmen and Supervisor have stated that the failure rate of the power conditioning units has notably declined. As of this paper, the Engineer has submitted a suggestion to have all fans exhausting the air from the interior.
 |
 |
|
Wheel after A/C unit was added |
|
Troubleshooting Help and Cost Avoidance
for A/C Chiller Problems
CASE #1
 |
 |
| Compressor Oil Separation Tubes | |
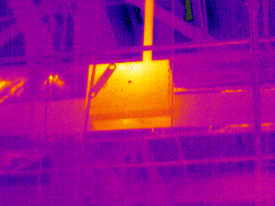
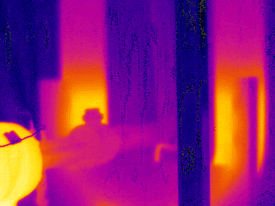
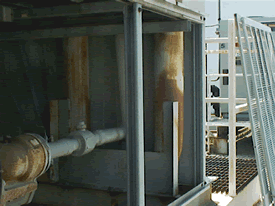
There are two large industrial chillers that are located outside of our Predictive Technologies office. The Electrician assigned to monitor and maintain these units encountered a problem. He wanted to know if the problem was due to a low oil level. He asked if there was any way we could use the infrared camera to confirm that the oil level was indeed low. He had accompanied me on previous Facilities PDMs, so he was aware of the capabilities of the infrared camera. We proceeded to the chiller, took off the side panels and exposed the U-shaped compressor refrigerant oil separation tubes.
He started the chiller and let it run until the oil had risen in temperature. We waited until the upper piping had cooled. I took a thermographic image of the piping showing the warm oil settled to the bottom. The Electrician had marked the pipe for the normal operating level of the oil. Using his finger for a proper oil level indicator, I took another thermographic image to check the proper level. The oil was at the proper level. Not only was this a time saving tool, this also saved an additional labor call. Normally the Electrician would have had a Pipefitter to assist him. The Pipefitter would have had to remove two fittings and replace them with an oil level tube. The Pipefitter would then go through a procedure to determine the level of the oil. This procedure is spelled out in the Operating manual as the proper way to determine the correct oil level. This new method has been shared with other Facilities Electricians that work with A/C and chiller units.
Through the use of the infrared camera, the Electrician determined the oil pressure differential switch needed to be properly adjusted. Another cost avoidance application for the infrared camera.
CASE #2
 |
 |
| Compressor Oil Line Solenoid Valve | |
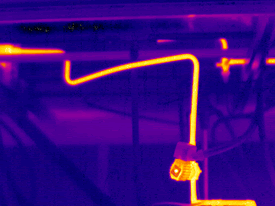
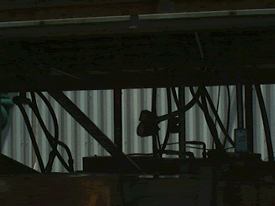
Four weeks later, the same Electrician came to me with a different problem on a chiller unit. This chiller had a low oil pressure alarm. He wanted to check the compressor oil line valve to make sure the solenoid valve was opening fully. He wanted to know if the thermographic image would capture the apparent temperature of both sides of the valve. The thermographic image confirmed the solenoid valve was working. The spot temperatures in the report indicated the same apparent temperature throughout both sides of the valve. This resulted in revealing a faulty oil pressure differential switch. Without the use of the infrared camera, the Electrician would have had to request a Pipefitter to disconnect the oil lines to determine if the valve was opening fully. As a result, we have used this method on other chillers with much success. Another cost avoidance application for the infrared camera.
Conclusion
The infrared camera or thermal imager has many different applications in an electrical components’ manufacturing facility. Whether it is facilities upkeep, engineering support, or simply helping production lines to continue to flow products, thermal imaging is an important component to help maintain a viable and safe manufacturing operation.
There are many ways to use the infrared camera as a maintenance tool. Whether it concerns scanning circuit boards, looking for “hot spots” on a substrate curing heater, or learning how the heat is exhausted on a product conditioning tester, innovative new troubleshooting applications will further cement the infrared camera as a must-have tool for manufacturing plants.
Visit out Sponsors:
Electrophysics


