Scott Cawlfield, President
Logos Computer Solutions Inc.
3801 14th Avenue West, Seattle, WA 98119Ph: 206-217-0577Fax: 206-217-0573www.LogosComputer.com
Abstract
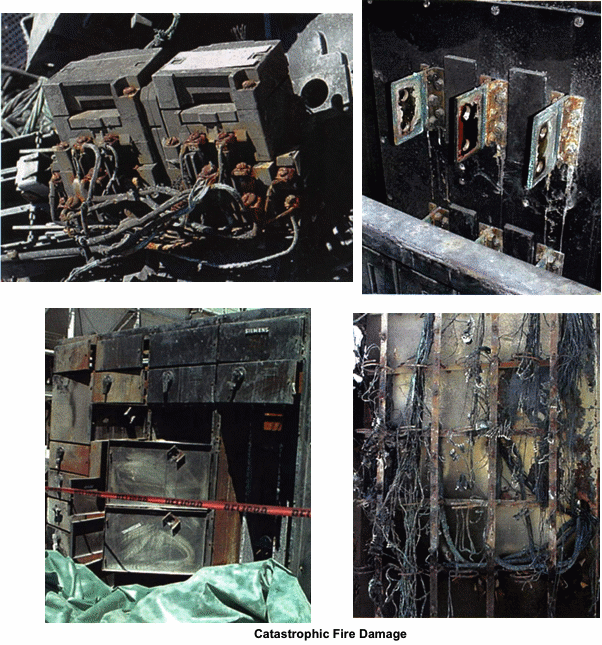
Equipment Fails! While it is not possible to predict the actual extent of damage, if any, that may occur, we do know that equipment fails. We also know that the failure can be from one end of the spectrum to the other. That is to say, a 400-amp circuit breaker can fail internally and simply will not allow a person to reset it to the on position. The same breaker can experience a tremendous amount of internal arcing, explode and the arcing carry over inside the Motor Control Center (MCC) to the point that the entire MCC is destroyed and the ensuing fire causes massive damage to the room and building.
Our approach in this paper is to focus on the more frequent failures and not dwell on extreme cases. While extreme cases are severe, they are much less frequent and do not aid in building an overall case for the cost/benefit analysis of an infrared program.
Equipment failures often have financial consequences that extend beyond the cost of replacing or repairing the damaged components. In some cases the cost of the component is the lesser of the expenses. Production downtime can sometimes far outweigh the cost of replacing the equipment or component. Trying to make a case for what can happen is difficult unless you provide examples of what has actually happened. Historical data can provide a bridge from the theoretical to the real world.
With 20/20 hindsight and a large set of data, we can summarize the documented loss to production and equipment repair costs. Using this data, we derive industry averages for cost benefit analysis creating a baseline or starting point for estimating future losses or savings. This paper is meant to provide information and a thought process for those conducting infrared surveys, whether inside their own company or as an outside contractor.
Discussion
Exhibit A is a spreadsheet of claims that have been submitted to the Hartford Steam Boiler Inspection and Insurance Company. These claims are a representative sample and are only related to equipment failures and the resulting losses to production, spoilage and extra expenses. These do not include damage to property such as buildings or contents. Catastrophic claims were removed from this data set since their occurrences were few and the data would raise the overall averages.
The spreadsheet has been broken down into like business categories. Most of the columns are self-explanatory. For those that are not, the following is offered:
MEA – Miscellaneous Electrical Apparatus. This is a catch-all for any electrical component that is not an electrical motor or generator. MEA would include breakers, relays, bus bars, cables, fused disconnects, control panels and starters, to name the main ones.
NOC – Not Otherwise Classified
Extra Expense – Cost the location incurred to stay in business as a result of the failure. For example, renting off-site office space while repairs are being made.
Primary and Secondary Causal Factors – These are what our investigators were able to determine as the most evident reason for the failure.
Blank spaces – These fields are left blank if information is not available with certainty.
In reviewing the spreadsheet, note that the amounts shown were submitted by the insured. While the insured experienced these costs, that is not what was reimbursed by the insurance company. At a minimum, the policy deductibles reduced all of the claims. This fact is noted so that anyone thinking that insurance is a substitute for good maintenance can set that idea aside. In addition, while insurance can try to make the insured whole, there is no coverage that will indemnify an insured for the loss of good will. In this day and age of “just in time” supplied components; the inability to make good on a commitment can result in the loss of future sales.
Exhibit A Statistics
| Number of Total Claims | 127 |
| Total Cost of the Claims | $25,835,957 |
| Average Cost of the Claims | $203,432 |
| Average Equipment Cost per Claim | $148,791 |
| Industry | # of Claims | Total Dollar Amount | Equipment Loss Amount | % of Total for Equipment |
| Office/Housing | 51 | $5,943,424 | $4,728,913 | 80% |
| Light/Medium Manufacturing | 33 | $7,778,282 | $6,778,511 | 87% |
| Food Processing | 22 | $2,919,347 | $1,566,038 | 54% |
| Health Care | 13 | $7,059,742 | $3,687,872 | 52% |
| Power Generation/Distribution | 5 | $1,880,004 | $1,879,974 | 100% |
| Retail | 3 | $255,158 | $255,158 | 100% |
As you can see in the chart above, Food Processing and Health Care tend to incur a great deal of expenses above and beyond the cost of the equipment loss. It should also be noted that depending on the type of insurance and coverage, production loss is not always covered or reported.
Types of Failures and their Frequency
| Number | Description | Percentages |
| 70 | Electrical Connection, Inadequate / Improper | 55.12% |
| 15 | Parts, Loosening of | 11.81% |
| 14 | Metallurgical Change (stress, fatigue) | 11.02% |
| 8 | Overloading | 6.30% |
| 5 | Cooling, Inadequate/Improper | 3.94% |
| 4 | Boiling Stress, Improper | 3.15% |
| 4 | Voltage, Improper | 3.15% |
| 3 | Conductor, Inadequate | 2.36% |
| 1 | Capacity, Inadequate | 0.79% |
| 1 | Corrosion, External | 0.79% |
| 1 | Misalignment | 0.79& |
| 1 | Vibration, Excessive | 0.79% |
| 127 | Total Failures | 100% |
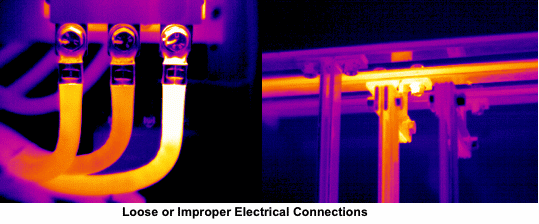
When starting a new infrared program, it is important to justify the cost of the program as well as the functionality of the technology. Of the 127 total claims in this data set, 85 claims or 67% were for “Inadequate/Improper Electrical Connection” or “Loosening of Parts”. Infrared technology is ideal at detecting these kinds of basic problems before the failure occurs. Of the total claims made ($25,835,957), 66% or $17,053,130 were from claims made resulting from “Inadequate/Improper Electrical connections” or “Loosening of Parts”. If we break these specific failures out by industry:
| Industry | Percentage of Failures* |
| Food Processing | 64% |
| Health Care | 67% |
| Light / Medium Manufacturing | 62% |
| Office / Housing | 69% |
| Power Generation / Distribution | 60% |
| Retail | 100%** |
* Percentages based only upon failure categories of “Inadequate / Improper Electrical connections” or “Loosening of Parts”.
** The Retail category did not have many claims made in this data set.
Across multiple industries, the basic failure of improper electrical connections is 60% or more depending on the industry.
Here are the root causes attributed to these failures.
Primary Root Causes
| Number | Description | Percentages of Known Root Causes |
| 45 | Maintenance Execution | 69.23% |
| 7 | Installation / Erection | 10.77% |
| 7 | Reliabilty Planning | 10.77% |
| 2 | Fabrication / Assembly | 3.08% |
| 1 | operator Error / Misuse | 1.54% |
| 1 | External | 1.54% |
| 1 | Equipment / System Design | 1.54% |
| 1 | Design Misapplication | 1.54% |
| 65 | Known Root Causes | |
| 62 | Unknown Causes | |
| 127 | Total Problems |
Of the primary root causes, almost 70% of the failures are caused by “Maintenance Execution”. Half of a comprehensive infrared program is finding the problems and the other half includes accountability and problem reconciliation procedures to fix the problems. The plant manager should be able to ask the two important questions: “Has all of our equipment been tested?” and “Did the problems that were found three months ago get fixed?” As we can see in Exhibit A of the “Primary Causal Factor” column, 45 out of the 65 known root causes were from “Maintenance Execution”. It is not clear from the data where the breakdown occurred from the initial problem documentation, transcription errors, work order generation, scheduling, repair, or follow-up inspections; but it is clear that a standard working procedure is needed to fix and reconcile the documented problems that are identified.
Also in Exhibit A, of the 46 documented Secondary Root Causes, 41, or almost 90%, of them were labeled “Procedures” or lack of them. Without an accountable, comprehensive infrared PdM inspection management program, unnecessary failures and losses will continue to occur.
Tracking Cost Benefits of your Infrared Program
For the company who wants to track the cost benefit of their own infrared program, inventory tracking and problem reconciliation procedures are necessary. Secondly, the cost to fix problems before vs. after failure must be tracked and systematically recorded. This will produce a running total of the conservative cost saving for the company as a result of the infrared program. Several example are shown below:
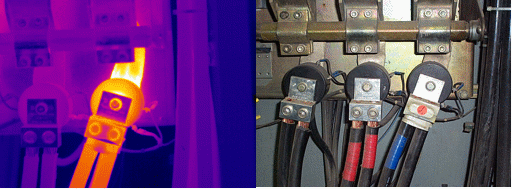
The conservative cost saving to fix this problem before failure versus after failure is based solely upon hard dollar figures of parts and labor.
| Before Failure | After Failure | Cost Savings for this problem |
| Parts=$50 (approx.) | Parts = $1000 (approx.) | Parts = $ 950 |
| Labor = 1 hr @ $35/hr = $35 | Labor = 2 hrs @ 35/hr = $70 | Labor = $ 35 |
| Total = $85 | Total = $ 1070 | Total = $ 985 |
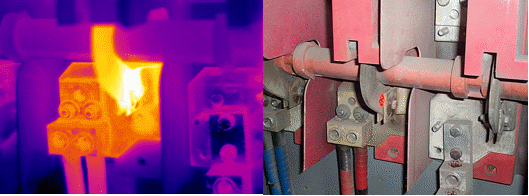
| Before Failure | After Failure | Cost Savings for this problem |
| Parts=$75 (approx.) | Parts = $800 (approx.) | Parts = $ 725 |
| Labor = 1 hr @ $35/hr = $35 | Labor = 2 hrs @ 35/hr = $70 | Labor = $ 35 |
| Total = $110 | Total = $ 870 | Total = $ 760 |
These examples of cost savings are extremely conservative since the actual damage afterward could easily range from $2,000 if not much else goes wrong, to the entire MCC burning up, in the worst case, and costing around $200,000 (and maybe more).
By using this system of comparing parts and labor “before” versus “after” failure, Logos Computer Solutions has derived an average cost savings ratio of 1:4. From a return on investment (ROI) perspective, infrared inspection programs have proven, on average, for every dollar spent on infrared electrical inspections, there is a four-dollar return on investment for materials and labor by fixing the problems before it fails.
This cost savings ratio was calculated from 10 years of data gathered using InspecTrend, an infrared PdM inspection management database. Hartford Steam Boiler (HSB) independently verified this ratio using their data and calculations. HSB also verified that if you take into consideration loss to production, spoilage, extra expenses, etc. that this ratio on average can be closer to 1:20!
Once a comprehensive infrared PdM program is set up and maintenance has good follow-up procedures, extreme examples of potential loss are reduced.
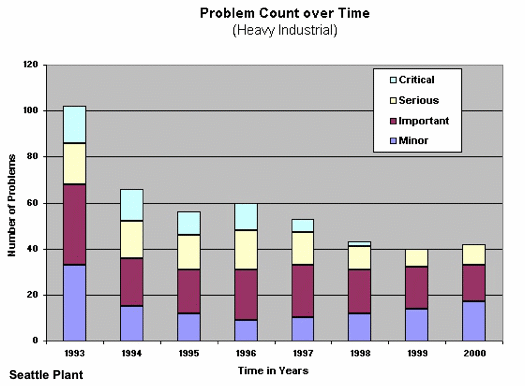
Since problems are being fixed before they cause a fire or shut down the production line, management may forget the benefits that infrared provides. At this time, management may start looking at cutting costs in the predictive maintenance program. Some managers may only see the costs of the program and not the savings when a comprehensive program is run properly but no cost saving documentation is produced. With this in mind, it is advantageous to have a running total of hard dollar cost savings for the program that can be brought to the attention of those in charge of budgets. By showing how much was conservatively saved on each problem documented, it is very easy to justify the cost of the infrared program and what it saves the company on an ongoing basis.
For example, in the year 2000, the infrared program documented 41 problems in the Seattle Plant and by fixing these problems before they failed vs. after, the company saved over $32,560 in parts and labor this year alone. These cost savings are very conservative and do not take into consideration loss to production, fire, spoilage, or other potential losses. Over the last 8 years, the Seattle plant has saved $389,000 since implementing their infrared program. Corporate wide, including Tacoma, Everett, Spokane, Moses Lake, and Tukwila, the infrared program has saved $215,000 in the year 2000 and over the last 8 years has saved 2.3 million dollars since its inception in 1993.
Conclusion
Even though we cannot predict the future, these three points will continue to be true:
1. Insurance is not a substitute for a good maintenance program.
2. Without an accountable, comprehensive infrared PdM inspection management program, unnecessary failures and losses will continue to occur.
3. Equipment will always fail and human error will always be a factor, so good thermographers will have job security as long as they can show their worth in bottom-line, real dollar savings to their customers and employer.


