Prof. Kenneth Ripberger
Department Chair Delgado Community College
Level 1 Certified Infrared Thermographer
KR Services
840 Helios Avenue, New Orleans, LA 70005Ph: 504-328-4152 www.krservices.comAbstract
Infrared thermography is well suited for the detection of wet surfaces during rain and also residual moisture in porous materials for only about 24 to 48 hours afterward the event, if exposed to air. This is because of temperature anomalies while drying due to evaporation.
In 2005, Hurricane Katrina flood water stayed for weeks in places where water should never be. Yet, most city inhabitants were able to return in no less than a few weeks after their areas were accessible. During this wait there was no rain, and everything dried quickly. So, when I was asked to evaluate structures to help determine the extent of water damage with infrared imaging, I suspected that most materials had long been dried, and the effort would likely yield no thermal anomalies consistent with latent moisture.
In many cases that was true, but to my surprise, in some situations the evidence was still apparent. I must have made a good choice of equipment. Long after flood/roof leak damage, modern IR imagers are so sensitive that they can show past events, due to some surface material E-factor change from chemical changes, regardless of uniform temperature. This retains a permanent record, like the “Carfacts” of a vehicle.
This paper will discuss the use of thermography to locate previous water damage to structures and defects within same, as well as the effects of substrate type and deterioration on the infrared measured surface.
Wort-case Long Term Flooding
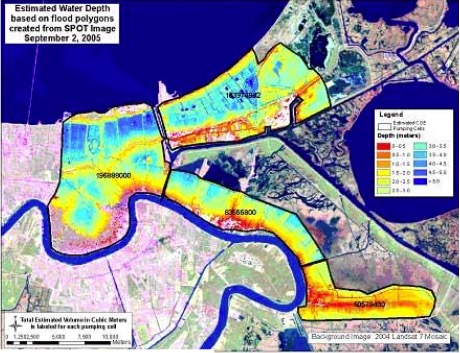
In 2005 Hurricane Katrina flood water stayed for weeks in places where water would never be. The Orleans side of the twin parishes was inundated with up to 9 feet of salt water from Lake Pontchartrain when its drainage canal levee walls breached during the storm. On the eastern side of this metro area, the levees simply were not high enough to stop the flow of Gulf water surging over the top, dumping up to 12 feet of sea water into neighborhoods. The remaining wall under the breaches prevented the resulting pool of water from receding after the coastal tide surge went down. This contrasted satellite image shows the city still flooded, two days after the storm.
Objectives
Moisture Location – Bulk and Residual
Actual residual moisture from past water events, ground seepage, or capillary action can be quite elusive without some thermal drive to highlight it. I have found depressurizing the building with a blower door doesn’t change the moisture image shapes, but with a few HOURS of run time, can sometimes better define the patterns with the evaporated cooler air that is pulled from the sources.
It does not follow any lines of the structure, and it shows up as a large observed cooling anomaly with no reasonable explanation. In fact, IT IS this process of elimination which leads to the suspicion of this type moisture. For instance, if the pattern in a particular instance cannot be attributed to solar warming, solar reflection, insulation deficiencies, HVAC leakage, or infiltration airflow, then at THAT point a trapped moisture pocket becomes the prime suspect. This is precisely why IR used in Building Science Diagnostics is time-consuming, and rarely “slam-dunk” like running water is.
The typical running water IR pattern seems to follow a non-linear appearance, much like the meandering roots of a tree through the ground. There sometimes will be an effect of gravity on it, exaggerated with rain water flow. The thermal effect is easy to find, with the multi-degree difference of contrast involved. I have also noticed that the residual patterns from moisture damage will also show this same appearance.
Moisture Damage Effect After a Flood
For weeks after Katrina there was no rain, and everything dried quickly. So when I was asked to evaluate structures for extent of water damage with infrared imaging, I suspected that most materials had long been dried, and the effort would likely yield no resulting information.
In many cases that was true, but, to my surprise, in some situations the evidence was still apparent. I must have made a good choice of equipment. Long after flood/roof leak damage, modern IR thermograms are so sensitive; they can apparently show evidence of past events. I concluded that since the effect of evaporative cooling and moisture density effect on actual surface temperature were long gone, that this could only be due to two possibilities:
1. A surface material change of E-factor from chemical changes or additions.
2. A density change due to degradation affecting R-value, typically a loss of mass.
Either of these would then retain a permanent record, like the “Carfacts” of a vehicle, possibly showing where moisture had wreaked havoc for an extended time.
Requests from potential clients for infrared imaging services, is sometimes a quest for moisture. Of course here, in a rich organic environment like Louisiana, where there is moisture there IS mold. But, as seasoned thermographers who have tried this have probably noticed, “moisture of the past” is a hard bugger to find with IR. Electrical, mechanical, and rain intrusion IR work are much easier to perform, when compared to moisture damage detection. The typical call is to “come check if you can see something”, primarily for inspection of ceiling, wall and floor system continuing issues.
Hurricane inflicted damage inspections have long passed here, that lasted for about two years. Today’s IR use lies in building science now, in the quest for unravelling the mysteries of poor building practices. And now, unfortunately, I also have to address poor RE-BUILDING practices, so “the beat goes on”. I will clarify this.
After Hurricane Katrina, labor was at an insane premium. If you could swing a hammer, you were hired. A lot of unskilled people, some with good intentions, were doing a lot of best-guess work, instead of best-practices work. IR inspection is helping to sort some of that out now as well. I mentioned this in a 2007 paper for IR/INFO:
“One must be forthcoming with input, advice, and closure. This is also in the public interest because without quick answers, much build-back occurs over mistakes, and is leaving a legacy of horrible problems here, which will be discovered months or even years later.”
It is also amusing, how the unmentionable word “Mold” is now as common as any other pronoun in the English language here. Gone is the fear of litigation for someone claiming mold exists in a building, now that fear has been replaced with the fear of an inadequate response to its presence.
IR Challenges
Temperature Differentials
Since many buildings damaged here were without electricity, their interior temperature was typically not much different than that outside. As a result, any IR imaging will have only faint image patterning from temperature changes on surfaces (Guideline, 6.1.2).
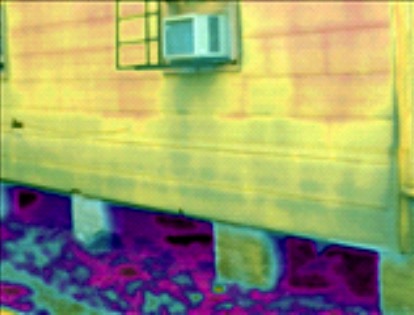
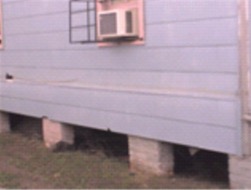
Emissivity Might be the Key
When I would get moisture patterns in structures which had no obvious reasons or source of surface heating or cooling, this normally lead me to believe that the emissivity factor of the surface might be affected by a moisture laden top surface layer (Level I – Overview, slide 3). This can still be a part of the image patterning factor with this IR application, this is the theoretical. But sometimes the lack of actual temperature difference just didn’t bear it out. Evident on the visible cover photo of this report, taken in the Gentilly area of New Orleans in April of 2006 – seven months after Katrina, you can see the flood water line was high enough to saturate the bottom three “weatherboards” (for three weeks). Not being able to come up with any other reason, I assumed that the original paint, still on the house, must have been affected enough to now show a different emissivity under IR now. There was no power on in this home, which I was doing a mold assessment on, and the inside was gutted.
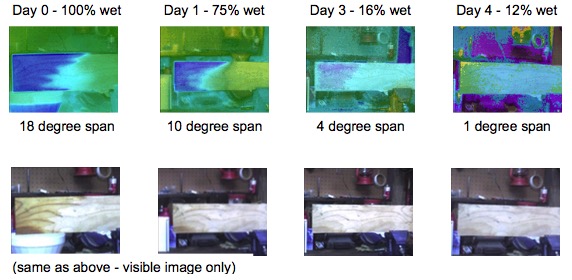
Some amateur garage experiments on my own seemed to imitate this. After soaking half of a piece of 1/2 inch new plywood for 24 hours, and using the dry side as a control, I took temperature, moisture content, and thermal images of the subject over time intervals. I took care to eliminate air movement as much as possible, to prevent evaporative cooling.
The ACTUAL board temperature left-to right delta-T, measured at drilled holes, and surface, with a digital thermocouple probe, stayed near zero between wet and dry side (within one-tenth of a degree) during four consecutive days. As the moisture content reduced, so did the IR pattern intensity. Note that the third image (on day 3) was still indicating an “IR temperature” difference from wet side to dry side, of 0.9 degree, at only 16% moisture content! In the last image on day 4, the board was starting to grow some mold, and a couple inches were showing a “warmer” temperature (I can only surmise the mold was causing few spots of extra higher-e on the far left side end). The moisture pattern was gone. I would be interested to see if some well-controlled and calibrated experiments funded under laboratory conditions might substantiate my observations. Did the wood composition change?
Pattern Identification
A thermographer must decide whether they want to delve into the responsibilities of deciding what the different IR patterns signify. Liability issues aside, this is also a time- consuming part of moisture damage identification which one must be prepared to deal with. Think about what the images above are really telling us. It may not be possible to know whether the moisture or water leak issue still exists, or only that there WAS one at some time in the past.
Equipment Demands
Because of the minute differences in IR detected temperature and emissivity; the imaging radiometer must be quite sensitive to see this. The need for this sensitivity, with exceptional display viewing, far outweighs the need for high resolution in this type of work. Equipment best suited will have a user definable range and span, to allow adjustment down to ten degrees or less of span. This ability, along with a selection of high contrast display palettes and large, bright view screens, will assist the thermographer during the field inspection to catch some areas of potential concern that may have gone unnoticed otherwise. Video output to a portable DVR is quite useful as well, for further study of anomalies that could be missed during field distractions.
Be aware that some capabilities may exist in the desktop software that is separate from the camera. You might be able to re-span range, change palette or zoom beyond what you can on the camera screen.
Post Processing Unavoidable
NOTE: There are some instances (for example if there is a high likelihood the IR images will wind up in a courtroom) where the original camera files should be copied first before performing any of this post processing (Level I – Program – Recording Data, Slide #4). At that point you can feel free to mutilate the copy image and still have the original legal image backed up, preferably to a CD.
One technique I mentioned which can sometimes yield useful results, is to reduce the image span down to as low as needed to see a pattern (see previous paragraph on emissivity). Color palettes are best for this. I’ve gone as low as less than one degree in some rare instances. If the camera does not allow this low of a setting, check the post- processing software you are using, you may be surprised learn that it is capable of this. While this would seem to be a ridiculously low span to even consider, the ability to generate the resulting ultra-high contrast can prove useful. But it is vitally important to realize what span and range you are looking at, and how it relates to what you’re looking for. With moisture detection, on surfaces where perhaps only the emissivity value has changed slightly, this technique may not yield any conclusive “courtroom” worthy results, but it could be HIGHLY beneficial to yourself, or a “mold hunter”, to know where to start probing around with other non-destructive/destructive testing.
Case Examples
Sycamore A: No brainer bulk moisture
In this inspection, we have a good example of a straight-up bulk moisture wetting problem at a window flashing. It had rained heavily the day before, and the sun was directly warming the wet wall the next morning.
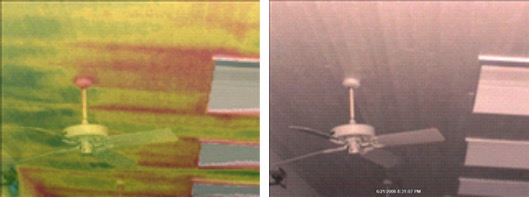
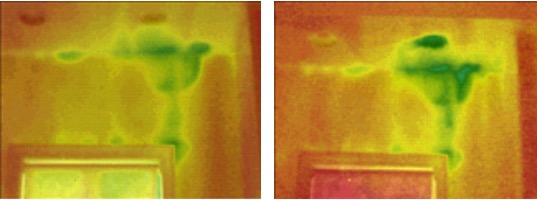
Bancroft: Residual damage mold growth pattern
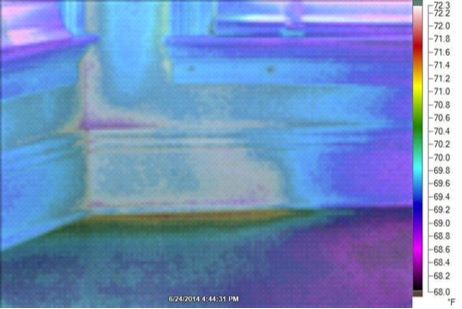
In this inspection, the client personally observed the water damage event, which involved a rainstorm occurring during an incomplete roofing repair job. The purpose of the IR imaging months later, after the roof was finished, was to ascertain the extent of any water intrusion into a beadboard roof-ceiling structure, for demolition decisions. I instructed the client to run the air-conditioning system non-stop for three hours before the inspection, and then shut it off a half hour before the scheduled inspection time. This created an apparent temperature shift for some active thermography, and worked quite well as the photos show. The ceiling was removed in its entirety and the fiberglass was loaded with mold. No moisture or temperature differences were measured directly on the ceiling wood surfaces during IR, nor was any wet insulation found during demolition. This was strictly due to material degradation of the wood.
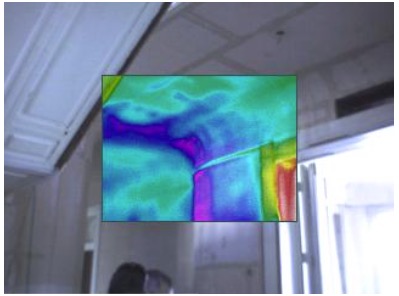
Uptown: Residual non-surface moisture pocket
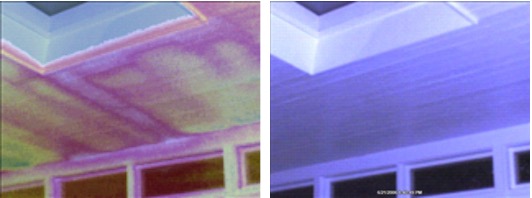
On this 120 year old home, there was a mold contamination problem on window woodwork in lower wall areas, and identifying the rain source was the goal. With the home being conditioned normally, the moist walls showed up quite readily since rainfall had occurred a couple days previous. Although there was also a considerable infiltration problem in this home, the patterning was too non-linear to be from infiltration.
The source turned out not to be the assumed rain water. Noticing the unusual anomaly on the left picture, showing up for no reason, I pursued this with a negative blower door test, since moisture patterns typically won’t change with infiltration, but will become more well-defined under airflow as stated before. The second picture shows the true source spot on the sheet rock still wet above, under a leaking drain line, feeding the moisture at the wall. The outside humidity slowed the drying of the outer wall only.
I surmised that the sheetrock material in the first picture had its emissivity altered by repeated wetting, but was not currently wet. Would you have caught this?
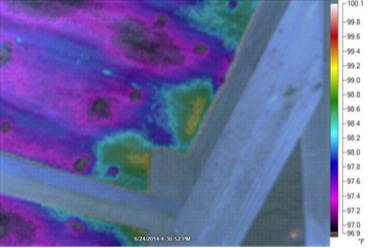
Sycamore B: Material degradation; R-value change
A home that had roofing repairs, yet had seal-tab shingles blow off during a mild rainstorm a year later. The plywood showed a distinct IR pattern in this 10/12 pitch roof. On closer inspection, this area under the deck was measured as completely dry, but a faint stain pattern matched the IR pattern. When physically pressed, the plywood was very soft, which explains why it wouldn’t retain the shingle nails.
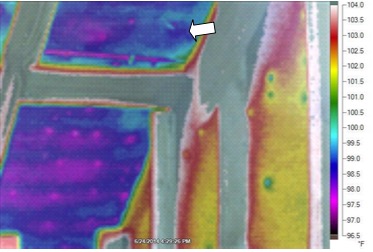
of 1.1 F, due to change of density of material. Still no moisture measured.
Spencer: Material composition change
In this case a major plumbing leak on the floor above saturated the plaster lathe ceiling and walls. The initial photo is two days after the event. Fans and commercial dryers were set up immediately. Three weeks later the second photo was taken, with no moisture detected in the plaster. Yet, a residual IR pattern at a low span range, still remained on some areas that had been soaked.
IR for Moisture Location, Solutions and Cautions
I believe at some point we could get to what one might call a “hangover” effect. Some anomalies may show from previous events, which have been since repaired, identified, ceased to occur, and were no-harm, no-foul events. With camera sensitivity, it will be important to verify sample areas with moisture meters, inspect with borescopes, or take small sample demolition pieces from inconspicuous areas, before declaring a verdict based only on IR.
But,
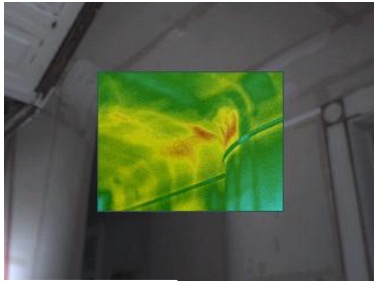
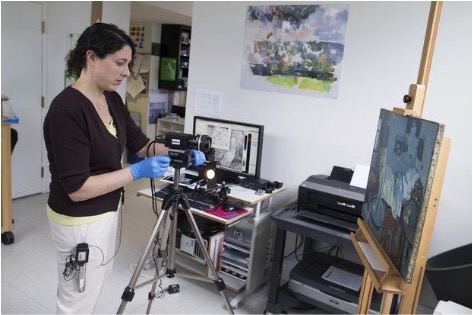
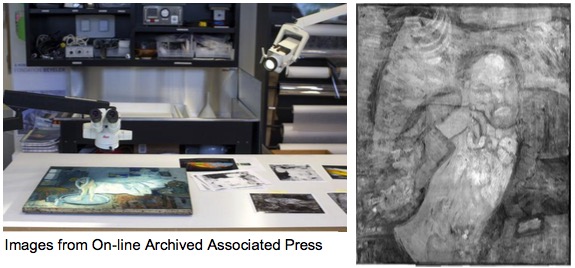
Then I ran across a news article bearing fruit for creative application of this “hangover” effect. Someone accidentally discovered that a Picasso original painting, when viewed with IR, showed a “ghost” image of a second original under the top coat. I would think a plausible explanation for this from a thermography standpoint, is that the first layer of paint had chemically altered the paint applied over it, changing its emissivity! There could obviously be no difference in temperature or moisture content in this case, since a priceless work of art would be surely protected from such variables.
“Scientists and art experts have found a hidden painting beneath one of Pablo Picasso’s first masterpieces, “The Blue Room,” using advances in infrared imagery to reveal a bow-tied man with his face resting on his hand.” (Zongker)
Visible Overlay
All of my case study IR images in this paper were created with an imager that “fuses” the visible image over the infrared image. While overlaying the visible image over the IR image is not a new concept, it should be implemented with the camera’s built-in software. With appropriate live blending of the two images, one can readily identify “landmarks” in the viewfinder to locate anomalies with pinpoint accuracy.
One of the ways the blended image does this, is that it optically outlines frames and tends to “posterize” the IR image. The effect mimics an improvement in IR resolution of the subject. Even if the IR Focal Plane Array is not at a cutting edge resolution, say for instance an older model 160×120, the perceived resolution becomes much greater. The feature also allows for much quicker focus adjustments, because when the parallax of the two images overlap perfectly, the IR also happens to come into perfect focus.
When using this feature, the client’s understanding of the IR image becomes crystal clear as well, and less interpretation is needed. At that point a picture really does “speak a thousand words”.
Potential for Abuse
There is certainly a potential for scam artists working the IR imaging profession, assuming they haven’t already. The equipment price and availability have plummeted over the last few years. For instance, by abusing the aforementioned low-span contrasting technique, you could basically find strange patterns on almost ANY surface. Blatantly selling false promises of success and fabricated interpretation of images is certainly possible.
To the general public, this is a high-tech, little understood technology, with all the bells and whistles of a carnival fortune teller with his crystal ball. That attribute is our advantage for selling the legitimate service, but it is also the shyster’s advantage to rip- off consumers. Careless misinterpretation of IR images by a legitimate company, out of sheer ignorance and lack of training could also occur. Not only is that is a disservice to the client, but it hurts the IR industry as a whole, and it is our responsibility to police our own before someone else does.
Summary and Opinion
Effectiveness of Application
While I too might consider my topic somewhat “radical”, I have seen the residual moisture assessment application prove itself numerous times, sometimes to my surprise. It’s also one hell of a “feather in your hat” when you get it right. It’s a good feeling, when you proclaim there is a possible moisture issue in a few spots in a home, and then the contractor decides to cut out entire walls and yet finds heavy mold infestations only at those pinpoint spots you suggested he check. And then the contractor gives you that funny “confused puppy” look. But proceed with caution.
Real Estate Market Inspection Needs
Property evaluation for real estate investors could benefit substantially from established IR inspection protocol. It’s hard for the Seller to dispute the picture of his overheating wiring within the walls, or the missing insulation, or poorly installed HVAC ductwork. The intended result is that the buyer gets a fair reduction on the purchase price. This would also be relevant in New Orleans, because of substandard build-back practices after Katrina.
Mold or Flood Damage
In the purchase or sale of property in Louisiana, a mold inspection and disclosure statement is required from the seller. But, moisture is the key to mold, so IR imaging could at least play a supporting role in those flooded neighborhood properties, where wood rot is likely. I find it very rare for a seller to welcome a thermographer during a real estate transaction. Of course, this type of intense scrutiny would only benefit buyers. Of interest primarily, would be ongoing wetting from roof leakage or plumbing. So much of this will be overlooked from a simple visual inspection.
There is not likely to be residual moisture from a flood 10 years ago, to be measured with a traditional surface meter, even though there could be structural damage unseen. But, since IR use in locating residual damage is still difficult and disputable at best, I feel these findings are not appropriate on a real estate inspection report without confirmed testing.
Final Thoughts
I believe IR imaging is most certainly a promising tool for moisture damage assessment, as the technology allows. I have touched upon many issues here and have tried to present a picture of opportunity in New Orleans and other recent history disaster areas, for the application of IR for moisture damage assessment. It is, at best, one of the more difficult and challenging missions for any Infrared Thermographer to accomplish.
(All un-referenced images property and courtesy of KR Services, Louisiana)
References
Infraspection Institute. “Level I Infrared Thermography. “Guideline for Infrared Inspection of Building Envelopes and Insulated Roofs. Burlington, NJ: 2005.
Infraspection Institute. Level I Infrared Thermography. Burlington, NJ: 2005.
Russell, Gordon. “Entergy Data shed Light on N.O.’s population.” The Times-Picayune 23 August 2006: A1
American Fact Finder. factfinder2.census.gov: cities over 50,000. 2013
Zongker, Brett. “Hidden painting found beneath Picasso masterpiece”. The Times- Picayune 17 June 2014: Arts Section. Print Newspaper article sourced from Associated Press.