Fault Zone Analysis: Six Part Series on Identifying Motor Defects
Noah P. Bethel
PdMA Corporation
5909C Hampton Oaks Parkway
Tampa, FL 33610
Ph: 813-621-6463 / Fax: 813-620-0206
Abstract
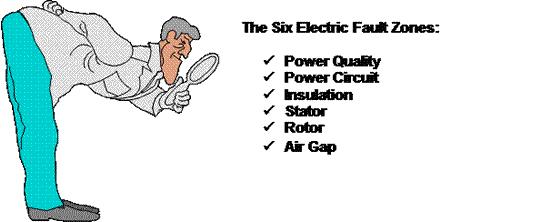
One of the biggest problems faced in analyzing electrical equipment is determining where the true problem is located. Fault Zone Analysis should be utilized to ensure that the actual problem is being detected and not just a secondary problem caused as a result of the real problem. This paper will discuss the diagnostic process for electric motors and outline six specific fault zones that should be looked at, which include the power circuit, insulation condition, stator condition, rotor condition, air gap and power quality.
Introduction
Electrical maintenance personnel have for years been limited to troubleshooting with no more than a multimeter and a megohmeter. Unfortunately, this does not provide enough information to allow most technicians to feel totally confident in determining if an electrical problem exists or not. A mechanical operator once said, “If a problem exists with a piece of equipment and there is an electric cable within fifteen feet of it then it must be an electrical problem!” If you are involved with electrical maintenance you have probably heard at some time in your career, “It must be the motor.” If you are into mechanical maintenance you have likely heard, “It’s probably the pump. Let’s uncouple it.”
This has been an on-going battle and, up to recently, technology has been primarily developed for the mechanical side. Vibration shows a two times line frequency (2FL) spike and that must mean it’s electrical. Right? …. Wrong!!!! There are so many variables producing a 2FL today that removing a motor from service for an electrical repair due only to a high 2FL is a mistake, possibly an expensive one. The best thing you could hope for is that the repair facility will call back asking, “What do you want done to this perfectly good motor?” More recently the battleground has moved from motor vs. pump to motor vs. drive. It seems as soon as technology is developed to solve a debate that another debate appears, advancing technology even further.
“Resistance to ground testing is all we need.” I find this statement hard to believe. How many times have we been nervous restarting a tripped motor after verifying with our trusty megohmeter that, “The motor is fine.” The fact is, numerous reasons can exist which cause a motor to trip that will not be seen by a megger, such as a turn-to-turn short. Breakdown in the insulation between individual turns of a winding can occur inside a stator slot or at the end turn and be completely isolated from ground. Phase-to-phase shorts can occur the same way. If these faults are left unattended, they can result in rapid deterioration of the windings, potentially ending in a complete motor replacement. Restarting a motor that has tripped should be considered only after these faults have been factored out.
Troubleshooting an electric motor that is suspected to have an electrical problem should not result in the statement, “The motor is fine.” Although someone with years of experience and tons of credibility may be able to get away with such a simple statement, most technicians won’t find the same positive response from their supervisor, engineer, or plant manager. To confidently report the electrical condition of a motor and ensure that your recommendation is taken seriously, there are six areas of interest known as Fault Zones that must be looked at during the troubleshooting effort. Missing any of these zones could result in missing the problem and losing credibility in your troubleshooting skills.
Power Quality
Power Quality has recently been thrust into the limelight by high demand on the utilities and the popularity of AC and DC drives. With high demand, the concern for power factor penalties and demand charges have increased. Variable frequency drives (VFD’s) and other non-linear loads can significantly increase the distortion levels of voltage and current. How can this distortion be minimized? What equipment is required, and is the concern purely financial or is equipment at risk?
In Part 1 of this six-part series we will discuss the real meaning of power quality problems as it pertains to motor health. We’ll discuss voltage and current harmonic distortion, voltage spikes, voltage unbalance, power factor, and the basic principle that ties them all together…HEAT.
Power Circuit
The power circuit refers to all the conductors and connections that exist from the point at which the testing starts through to the connections at the motor. This can include circuit breakers, fuses, contactors, overloads, disconnects, and lug connections. A 1994 demonstration project on industrial power distribution systems found that connectors and conductors were the source of 46% of the faults reducing motor efficiency. In Part 2 of this six-part series we will discuss the impact of power circuit problems on motor health.
Insulation Condition
This refers to the insulation between the windings and ground. High temperatures, age, moisture, and dirt contamination all lead to shortened insulation life. It has been said that if plants would just use the space heaters available to keep the insulation dry, then doubling the life of our motors would not be out of the question. In Part 3 of this six-part series we will discuss the standards governing insulation condition and how best to apply them to ensure the ground insulation on our motors has the longest possible lifespan.
Stator Condition
When we mention the stator, we are referring to the DC or 3-phase AC windings, insulation between the turns of the winding, solder joints between the coils, and the stator core or laminations. This fault zone creates a lot of debate as to the cause and rate of failure. In Part 4 of this six-part series we will discuss the various root causes of stator faults and how to identify conditions conducive to stator faults so they can be corrected.
Rotor Condition
This refers to the rotor bars, the rotor laminations, and the end rings of the rotor. In the 1980’s, a joint effort between EPRI and General Electric showed that 10% of motor failures were due to the rotor. The rotor, although a small percentage of the motor problems, can influence other fault zones to fail. In Part 5 of this six-part series we will discuss the various fault mechanisms of rotor failures, the impact on motor health and the severity of rotor faults based on rotor design.
Air Gap
This relationship references the air gap between the rotor and stator. If this air gap is not evenly distributed around the 360 degrees of the motor, uneven magnetic fields can be produced. These magnetic imbalances can cause movement of the stator windings, resulting in winding failure, and electrically induced vibration, resulting in bearing failure. In Part 6 of this six-part series we will discuss the various types of eccentricity, what may cause them and how to identify air gap anomalies using static and dynamic test methods.
Conclusion
In conclusion, the term “The motor is fine” is just not enough to ensure that we are taken seriously and that a true assessment of a motor’s health has been performed. If the decision is up to you as to what to do in a troubleshooting or diagnostic situation, look at the whole picture. If at all possible, do not make a quick decision. Break the system down into its individual fault zones, test each fault zone completely with every technology available to you, and finally make your recommendations, written or verbal, using the terminology used in fault zone analysis to express your confidence and capabilities.
Part 1: Power Quality
By developing a methodical step-by-step process, the EMAX Power Analysis test results can quickly be used to assess three of the six Fault Zones. These Fault Zones are derived from the most common electrically related motor failures in an industrial environment. This article focuses primarily on the Power Quality Fault Zone, followed by a recommended process to evaluate the data recorded during a Power Analysis (PA) capture.
Power Quality refers to the condition of the voltage and current signal. Mechanisms that can cause poor power quality include single and three phase non-linear loads, variable frequency drive units, starting and stopping of nearby equipment, voltage spikes, and more. These influences can cause excessive harmonics in the distribution system, which can result in overheating of the insulation system.
Power Quality = Voltage Quality
The common term is Power Quality, but what we are actually evaluating is the quality of the voltage that is being supplied to the motor circuit. The power supply system can only control the quality of the voltage; it has no control over the currents that a particular load might draw.
PdMA’s EMAX Power Analysis test allows a technician to take a Power Quality snapshot in order to see the condition of the voltage signal and evaluate the effect it will have on the motor. The actual sample time for the simultaneous measurement of the three voltage and current phases is 0.17 seconds. From this snapshot, the technician focuses primarily on the three phase-to-phase voltages that power the motor and determines what effect they are having on motor performance.
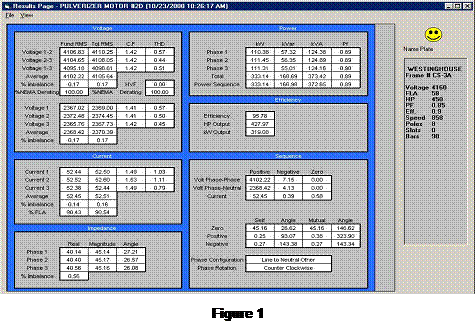
Data used to evaluate Power Quality are located in the phase-to-phase voltage section of the Results Page (Figure 1). Fundamental RMS, Total RMS, Crest Factor (CF), and Total Harmonic Distortion (THD) are listed for each of the phase-to-phase voltages. The average voltage and percent imbalance are also listed. Additionally, recommended NEMA derating factors are provided for both phase-to-phase voltage imbalance and Harmonic Voltage Factor (HVF).
Phase-to-Phase Voltage Imbalance
When line voltages applied to an induction motor are not equal, negative sequence currents are introduced into the motor windings. These negative sequence currents produce an air gap flux rotating opposite the rotation of the motor. This reduces motor torque, affecting its operation and increasing the 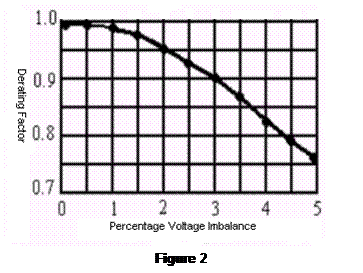 temperature of the motor.
NEMA provides a recommended derating factor based on percent voltage imbalance (Figure 2). Do not run a motor when the voltage imbalance is greater than five percent (per NEMA MG-1). With a phase-to-phase voltage imbalance, rated horsepower of an induction motor should be multiplied by the derating factor. If the load on the motor exceeds this derated value, take steps to correct the imbalance. Running the motor with the imbalanced voltage will cause excessive temperature rise in the windings and damage the insulation.
Terminal Voltage
Terminal voltage has a major effect on motor performance. The effect of low voltage on electric motors is well known and understood; however, the effect of high voltage on motors is often misunderstood. In the next paragraphs we cover the effects of low and high terminal voltages.
Low Voltage
When a motor is operated below nameplate rated voltage, some of the motor’s characteristics will change slightly and other characteristics will change more dramatically. To drive a fixed mechanical load, a motor must draw a fixed amount of power from the circuit. The amount of power is roughly related to voltage times current. So, with a lower voltage, there will be a rise in current to maintain the required power. This in itself is not alarming, unless the rise in current exceeds the nameplate current rating for the motor. When this happens, the buildup of heat within the motor will damage the insulation system.
Aside from the possibility of over-temperature and shortened insulation life, other important effects on the motor’s performance need to be understood. Starting, pull-up, and pull-out torque of induction motors all change based on the applied voltage squared. Thus, a 10% reduction from nameplate voltage (100% to 90%, 480 to 432 volts) would reduce the starting, pull-up, and pull-out torque by a factor of .9 x .9. The resulting values would be 81% of the full voltage values. At 80% voltage, the result would be 64% of the full voltage values. Clearly, it would be difficult to start those hard-to-start loads under such conditions. Similarly, the motor’s pull-out torque will be much lower than during normal voltage conditions.
High Voltage
A common misconception is that high voltage tends to reduce current draw on a motor, since low voltage increases current. This is not always the case. High voltage on a motor tends to push the magnetic portion of the motor into saturation. This causes the motor to draw excessive current in an effort to magnetize the iron beyond the point to which it can easily be magnetized. Generally, motors will tolerate a certain change above nameplate voltage; however, extremes above this value will cause the amperage to go up with a corresponding increase in heating and a shortening of motor life. For example, older motors were rated at 220/440 and had a tolerance band of +/- 10%. Thus, the voltage range for the 440-volt motor would be 396 to 484. Even though this is the so-called tolerance band, the best performance would be at rated voltage. Operation at the ends of this band would put unnecessary stress on the motor.
These tolerance bands are in existence not to set a standard that can be used all the time, but rather to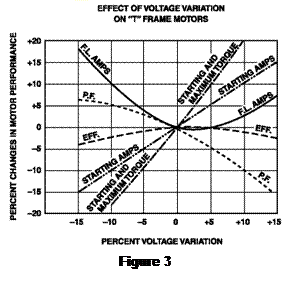 set a range that can be used to accommodate the normal hour-to-hour swings in plant voltage. Continuous operation at either the low or high end of the band will shorten the life of the motor.
The graph shown in Figure 3 is widely used to illustrate the general effects of high and low voltage on the performance of T-frame motors. It is okay to show general effects, but remember, these effects will change slightly from one motor design to another.
In older plants, some compromises may have to be made because of the differences in the standards for older motors (220/440) and the newer T-frame standards (230/460), but voltage in the middle of these ranges will generally result in the best overall performance. High voltages will always tend to reduce power factor and increase losses in the system, which results in higher operating cost for the equipment and the system.
The following guidelines are provided for assistance in evaluating the voltage of a motor circuit:
- Small motors tend to be more sensitive to over-voltage and saturation than large motors
- U-frame motors are less sensitive to over-voltage than T-frames
- Premium/High efficiency motors are less sensitive to over-voltage than standard efficiency motors
- Over-voltage can drive up amperage and temperature even on lightly loaded motors; thus, motor life can be shortened by high voltage
- Full load efficiency drops with either high or low voltage
- Power factor improves with lower voltage and drops sharply with high voltage
- In-Rush current goes up with higher voltage
Simply put, the best life and most efficient operation of electric motors occurs when motors are operated at voltage as close to nameplate ratings as possible.
Harmonics
NEMA derating for harmonic content, Harmonic Voltage Factor (HVF)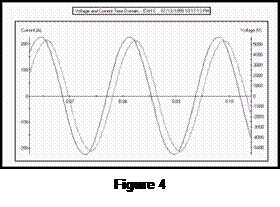
The presence of harmonic distortion in the applied voltage to a motor will both increase electrical losses and decrease efficiency. These losses will increase motor temperature, resulting in even further losses. To aid the technician in evaluating the effect that the harmonic content of the voltage is having on the motor’s performance, EMAXprovides the HVF and recommended derating factor.
Harmonics is the name given to distorting signals that are sinusoidal in shape and occur in multiples of the fundamental frequency. Non-linear loads generate these harmonics.
Linear loads are electrical load devices that, in steady state operation, present essentially constant impedance to the power source throughout the cycle of applied voltage. An example of a linear load is an induction motor. Note how the current is proportional to the voltage throughout the sinewave (Figure 4).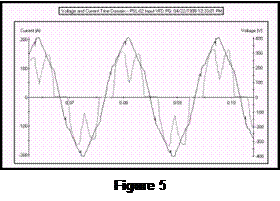
Non-linear loads are electrical loads which draw current discontinuously or whose impedance varies throughout the cycle of the input AC voltage sinewave. Examples of non-linear loads in an industrial distribution system are arc lighting, converter power supplies for VFD’s (6 and 12 pulse), and DC power supplies. An example of a discontinuous current draw is shown in Figure 5, a phase of voltage and current supplying a VFD.
High harmonics can result in a rise in motor temperature. NEMA has addressed this temper-ature rise during operation and whether the motor needs to be derated due to harmonic distortion of the voltage signal. In NEMA’s Standards Publication Number MG-1, the Harmonic Voltage Factor (HVF) derating curve is provided to aid the technician in evaluating the severity of the problem.
When performing PA testing of motor circuits, the EMAX samples the applied voltage signal. It analyzes the voltage waveform, identifies the fundamental frequency and all harmonics present and their percent of the waveform. With this information the HVF is calculated and, if required, recommended derating per NEMA guidelines is provided. The HVF Derating Curve is shown in Figure 6.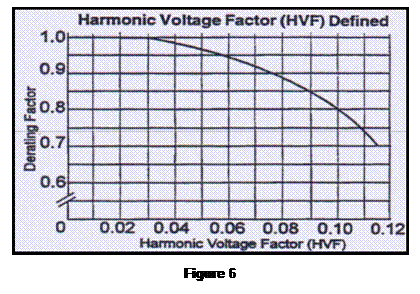
NOTE: The curve does not apply when the motor is operated at other than rated frequency or when operated from a variable voltage or frequency source (VFD).
There is usually no need to derate motors if the voltage distortion remains within the Institute of Electrical and Electronic Engineers (IEEE) Standard 519-1992 limits of 5% Total Harmonic Distortion (THD) and 3% for any individual harmonic. Excessive heating problems begin when the voltage distortion reaches 8 to 10% and higher. Such distortion should be corrected for long motor life.
Conclusion
The MCEMAX Power Analysis test provides a wealth of detailed information for identifying the power quality in your distribution system. In addition, this simple to perform test also provides the data required for detailed evaluation of motor circuits that utilize variable frequency drives. Phase-to-phase voltage, harmonic distortion, bus voltage, and total harmonic distortion all have an effect on the performance and condition of a motor. The MCEMAX tests provide you with what you need to know to make the informed decisions that lead to a successful motor management plan.
Part 2: Power Circuit
When evaluating the condition of any Fault Zone, it is a good practice to use as many technologies as possible. The focus of this article is to describe the Power Circuit and how to develop methodologies to identify anomalies within the Power Circuit.
Power Circuit refers to all the conductors and connections that exist from the power supply bus to the connections at the motor. This can include circuit breakers, fuses, contactors, overloads, disconnects, and lug connections. A 1994 study on industrial power distribution systems found that connectors and conductors were the source of 46% of the faults reducing motor efficiency. Many times a motor, although initially in perfect health, is installed into a faulty power circuit. This causes problems like voltage imbalances, current imbalances, etc. As these problems become more severe, providing the same horsepower output from the motor requires more current, causing temperatures to increase and insulation damage to occur.
One test provided by the MCEMAX to assist in analyzing the power circuit is the Power Analysis test. The Power Analysis test is performed on energized AC Induction, AC Synchronous, AC Wound Rotor Motors, and motors being powered by a VFD. The Power Analysis test indicates anomalies in the power circuit, power quality, and the stator fault zones. The focus of this article is the power circuit fault zone.
High resistance connections in the power circuit result in unbalanced terminal voltages at the motor. The consequences of unbalanced terminal voltage are: overheating of the components adjacent to the high resistance connection, loss of torque, other phases drawing additional current to compensate, overheating of the insulation system, and a decrease in motor efficiency. Voltage imbalances will cause the motor to draw more current in order to perform the required work. Therefore, not only does the customer face premature motor burn out (or single-phasing), but they also may pay for extra kilowatt-hours and possibly a demand penalty.
Another result of voltage imbalance is the creation of negative sequence currents. These currents are called “negative sequence” because of the development of a magnetic field opposing motor rotation. This added load requires the motor to draw more current to power the load being driven. The long-term effect will be shortened insulation life due to the added thermal stress.
The values from the Power Analysis test that are used to evaluate the health of the power circuit are: phase-to-phase voltage, phase-to-phase current, and their respective imbalances. These measured values are recorded and compared against industry standards. Due to the negative effects from an imbalanced bus voltage, NEMA MG-1 recommends that a motor not operate if the voltage imbalance reaches 5%. NEMA provides a Derating Curve that shows a factor for derating motor horsepower due to the voltage imbalance experienced by the motor.
Unbalanced power delivery not only causes a voltage imbalance, but it will also cause a much higher percent current imbalance. Some thumb rules to apply when troubleshooting the power circuit:
- A 1% voltage imbalance can result in a 6 – 7% current imbalance, according to the Electrical Apparatus Service Association (EASA)
- A 3.5% voltage imbalance can raise winding temperatures by 25%, according to the Electrical Power Research Institute (EPRI)
- A 10° Celsius increase in winding temperature (above design) can result in a 50% reduction of motor life
Phase voltage unbalance causes three phase motors to run at temperatures greater than their published ratings. This excessive heating is due mainly to negative-sequence currents attempting to cause the motor to turn in a direction opposite to its normal rotation. These higher temperatures soon result in degradation of the motor insulation and shortened motor life. The percent increase in temperature of the highest current winding is approximately two times the square of the voltage unbalance. For example, a 3% voltage unbalance will cause a temperature rise of about 18% (32 x 2 = 18).
The greater the unbalance, the higher the motor winding temperature and the sooner the insulation will fail. NEMA standards recommend a maximum voltage unbalance of 1% without derating the motor. The motor can be derated down to 75% for a maximum of a 5% voltage unbalance. If the voltage unbalance exceeds 5%, it is recommended that the motor not be operated.
Now that the negative effects from unbalanced voltage and current due to power circuit anomalies have been discussed, how does the MCEMAX tester identify these anomalies? The easiest method to test a power circuit is to use the Power Analysis test while the motor is operating under normal conditions.
A current imbalance is a possible indication of a high resistance connection. However, a voltage as well as a current imbalance is a better indicator. What determines whether both imbalances are present in the event of a high resistance connection is the test location.
Voltage and current imbalances aren’t both a requirement in the event of a fault in the power circuit. There can be many different looks to a high resistance connection, a power circuit component failure, or an imbalance that points to another fault zone.
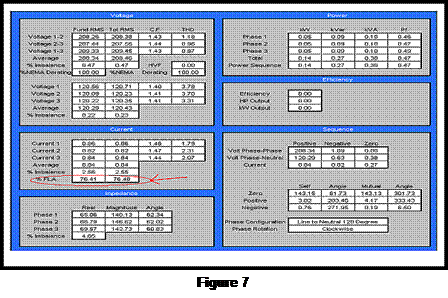
Trending power circuit anomalies is most effective at similar loads. Higher loads may result in the fault being more obvious due to the stresses being greater at higher loads. The easiest way to verify the current draw of a motor is by looking at the % FLA in the Current section on the Results page (Figure 7).
 Here, the technician’s awareness to properly troubleshoot the power circuit will prove invaluable. As men-tioned earlier, a current imbalance is a possible indicator of a power circuit anomaly. This is because the location of the anomaly in reference to the EMAX voltage test leads will show different imbalances.
However, measured current values are consistent regardless of test location. Figure 8 shows how voltage readings can change based on test location.
If the test is being performed upstream of the anomaly, then there will only be a current imbalance, and if the test is downstream, there will be both a current and voltage imbalance. If the technician can’t safely get closer to the motor for retesting, then further troubleshooting using the MCE Standard Test, should be performed when the motor is de-energized.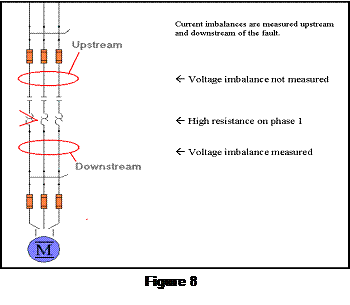
Loads using three-phase power sources are subject to loss of one of the three phases from the power distribution system. This condition is known as single-phasing. The loss of one phase, or leg, of a three-phase line causes serious problems for induction motors. The motor windings overheat due primarily to the flow of negative-sequence current, a condition that exists anytime there is a phase-voltage imbalance. The loss of a phase also inhibits the motor’s ability to operate at its rated horsepower.
Conclusion
In conclusion, a high resistance connection results in voltage and current imbalances, which reduces the horsepower rating significantly. When a good motor is installed into a faulty power circuit, it causes problems with power imbalances as well as negative sequence currents. As the problems become more severe, the horsepower rating of the motor drops causing temperatures to increase, resulting in overheating of adjacent components, damage to the rotor, stator, insulation, shortened motor life, reduced motor efficiency, motor failure, or fire. While damage to the rotor, stator, or insulation might be symptoms of a problem, the root cause still lies with the power circuit. Replacing the motor without fixing the high-resistance connection causes the failure cycle to begin again.
Part 3: Insulation
The importance of sound electrical insulation systems has been acknowledged from the early days of electricity. As the years passed and the electrical industry expanded, the need for improved electrical insulation system testing became even more significant. The designs and applications of electrical equipment are almost infinite in their variety, but all units have one common characteristic. For electrical equipment to operate properly, one of the most important characteristics is that the flow of electricity takes place along well-defined paths or circuits. These paths are normally limited to conductors, either internal or external to the electrical component. It is important that the flow of current be confined; not leaking from one path to another through material not intended to be a conducting path.
Deterioration of insulation systems can result in an unsafe situation for personnel exposed to the leakage current. Ensuring that the insulation system is confining the flow of electrical current to the intended conducting path ensures that personnel coming into contact with the insulation are not at risk of becoming a lower resistance conductor path for current-to-ground than the intended path.
Just as the walls of a pipe contain the flow of fluid, the insulation surrounding a conductor confines the flow of electric current. The walls of a pipe may have impurities, cracks, or other defects that limit its ability to withstand the pressure of the fluid. The insulation may develop impurities, cracks, or other defects that limit its ability to withstand electrical potential, which is the force or voltage that drives the flow of electrons (current) through the electrical circuit.
Despite great strides in electrical equipment design in recent years, the weak link in the chain is still the insulation system. When electrical equipment fails, more often than not the fault can be traced to defective insulation. Even though an electric motor is properly designed and tested prior to installation, there can be no guarantee that a fault in the insulation will not occur at some time in the future.
Many outside influences affect the life of electrical insulation systems. Outside influences include contamination of the insulation surfaces with chemicals from the surrounding atmosphere that attack and destroy its molecular structure, physical damage due to improper handling or accidental shock, vibration, and excessive heat from nearby industrial processes. Voltage transients in the conductors inside the insulation, such as surges or spikes caused by variable frequency drives, can lower the dielectric strength to the point of failure. The deterioration occurs in many ways and in many places at the same time. For example, as chemicals and/or heat change the molecular structure of the insulating materials they become conductive, allowing more current to be forced through them by voltage, resulting in leakage current.
Properly conducted insulation system testing, analysis of the data collected, and appropriate corrective action can minimize the possibility of failures. Therefore, the significance of understanding insulation system testing has never been more important.
Safety
IEEE 43-2000 states that before any insulation testing can take place, safety must be addressed. It is 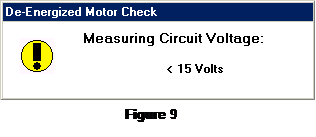 not safe to begin testing until the discharge current is negligible and that there is no discernable return voltage. The return voltage should be less than 20V after the ground is removed. The MCE (Motor Circuit Evaluation) tester checks for this voltage before allowing testing. In order to start testing, there needs to be less than 15V line-to-neutral voltage before the test will begin (Figure 9).
Also, for testing at 5000V, the lead between the tester and the winding must be appropriately insulated and spaced from ground. Otherwise, surface leakage currents and corona loss may introduce errors into the test data.
Definitions
By definition, the insulation resistance is made up of the applied direct voltage across the insulation divided by the total resultant current. The total current is the sum of four different currents: surface leakage, geometric capa-citance, conductance, and absorption.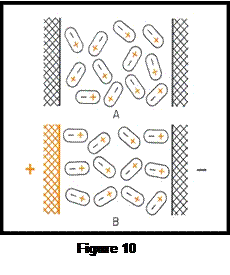
The surface leakage current is constant over time. Moisture or some other type of partially conductive contamination present in the machine causes a high surface leakage current, i.e., low insulation resistance.
The geometric capacitance current is a reversible component of the measured current on charge or discharge that is due to the geometric capacitance. That is, the capacitance as measured with alternating current of power or higher frequencies. With direct voltage, this current has a very short time constant and does not affect the usual measurement.
The conduction current in well-bonded polyester and epoxy-mica insulation systems is essentially zero unless the insulation has become saturated with moisture. Older insulation systems, such as asphaltic-mica or shellac mica-folium may have a natural and higher conduction due to the conductivity of the tapes used on the back of the mica.
The absorption current is made of two components – the polarization of the insulation material and the gradual drift of electrons and ions through the insulating material. The polarization current is caused by the reorientation of the insulating material. This material, usually epoxy, polyester, or asphalt tends to change the orientation of their molecules when in the presence of a direct electric field. It normally takes a few minutes of applied voltage for the molecules to be reoriented, and thus for the current-supplied polarizing energy to be reduced to almost zero. The absorption current, which is the second component, is the gradual drift of electrons and ions through the insulating material. These electrons and ions drift until they become trapped at the mica surfaces usually found in rotating insulation systems (Figure 10).
Section A of Figure 10 shows the random orientation of the insulation’s molecules. As a direct voltage is applied via the MCE tester, the molecules start to polarize and align (see Section B of Figure 10). The energy required to align the molecules, and subsequently reduce the number of escaping molecules, is known as absorption current.
Since absorption current is a property of the insulation material and the winding temperature, a specificabsorption current is neither good nor bad. The absorption currents will vary between different insulating materials. Prior to 1970, older thermoplastic materials used were typically asphalt or shellac, which have a higher absorption current. After 1970, the shift was made to thermalsetting polyester or epoxy bonded insulating material, which significantly decreased the absorption current. Nonetheless, this doesn’t mean that the more modern insulating materials are better because they have less absorption current.
The MCE tester measures the sum of all the currents, also called total current and calculates the resistance-to-ground values.
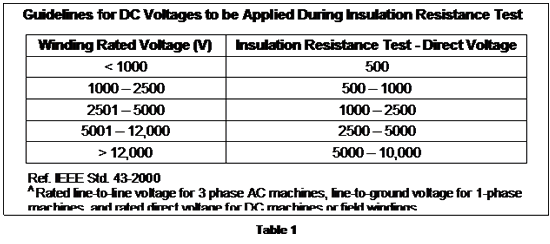
The amount of applied voltage must be appropriate to the nameplate voltage and the basic insulation condition. This is particularly important in small, low-voltage machines where there is only a single layer of insulation. If test voltages are too high, the applied voltage may over-stress the insulation. The MCEMAX tester has a low current output. The maximum current output is 1 milliamp, or 1000 microamps, but normally the tester only outputs in the microamp range. This limits the likelihood of insulation damage. See Table 1 for recommended voltage application.
Effects from Contamination
There are many factors that can affect insulation resistance. The surface leakage current is dependant upon foreign matter, such as oil and carbon dust on the winding surfaces outside the stator slot. The surface leakage current may be significantly higher on large turbine generator rotors and DC machines, which have relatively large exposed creppage surfaces.
Dust and salts on insulation surfaces, which are ordinarily nonconductive when dry, may become partially conductive when exposed to moisture or oil, and this will cause increased surface leakage current and lower insulation resistance.
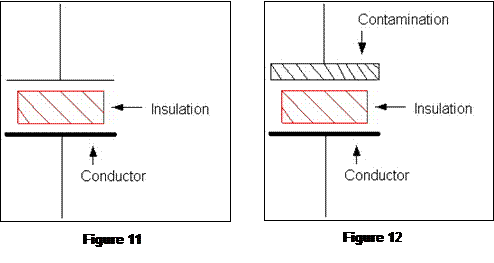
The reason a motor’s capacitance increases with contamination is because of how a capacitor works. Any two conducting materials, called plates, separated from each other by a dielectric material, form a capacitor. A dielectric material is anything that is unable to conduct direct electric current. A cable or motor winding surrounded by insulation provides one conductor and the dielectric material. The second plate is formed by the stator core and motor casing iron. It is this second plate that is increased in plate size as contamination builds up (Figures 11 and 12).
Effects of Temperature
A higher temperature affects the resistance of both the insulation and conductor. There is a term called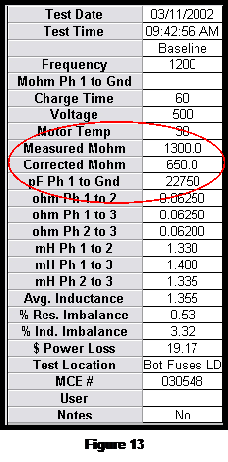 temperature coefficient (KT). A material has either a positive or negative KT. If the material has a positive KT, then with added heat the resistance readings will increase. Inversely, if a material has a negative KT, then the resistance readings will decrease with higher temperature. In metals, i.e., the magnetic wire of the stator, higher temperature introduces greater thermal agitation and reduces the movement of free electrons. Because of this reduction in free movement, the resistance readings will increase with added heat and therefore the conductor has a positive KT. However, in insulation the added heat supplies thermal energy, which frees additional charge carriers and reduces the resistance reading. Therefore, an increase in temperature on insulation reduces the resistance and it is said to have a negative KT. This higher temperature affects every current except the geometric capacitive current.
The recommended method of obtaining data for an insulation resistance versus winding temperature curve is by making measurements at several winding temperatures, all above the dew point, and plotting the results on a semi-logarithmic scale. A semi-logarithmic scale is the same type of scale used to track earthquake activity, called the Richter scale. Earthquake behavior needs to be graphed so that small tremors, as well as a magnitude 9, are still visible on a chart. Nonetheless, the results should plot out to be a straight line.
Since this type of temperature coefficient plotting is usually not feasible, IEEE has developed a corrective rule of thumb. This standard states that to avoid the effects of temperature in trend analysis, subsequent tests should be conducted when the winding is near the same temperature as the previous test. Otherwise, the insulation test values are corrected to a common base temperature of 40°C.
Therefore, resistance-to-ground (RTG) readings must be temperature corrected for trending and comparison purposes. Temperature correction of the reading is required because the temperature of the insulation system under test may vary depending on operating conditions prior to testing, atmospheric conditions, or ambient temperature. Insulation material has a negative temperature coefficient which means that the resistance characteristics vary inversely with temperature.
In the test setup screen of a Standard test, the temperature of the windings is imputed. The Measured Mohm value is then adjusted to a temperature correction of 40?C. The result is the Corrected Mohm (Figure 13).
RTG Reading
To accurately trend RTG for one motor over time, keep the test voltage and duration of applied voltage constant. The only other factor that will affect the RTG reading is temperature, therefore, it is necessary to correct the temperature in the test setup screen.
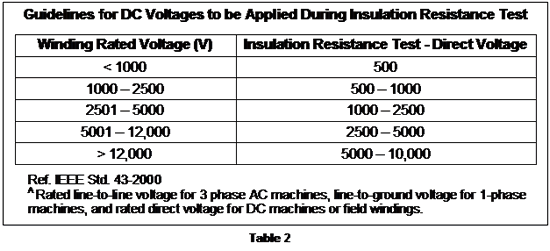
IEEE recommended applied voltages can be seen in Table 2.
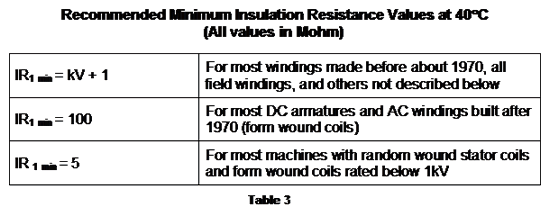
The temperature corrected megohm readings should be recorded and graphed for comparison over time. If a downward trend is observed, look for dirt or moisture. A single reading will not have much meaning in regards to the overall health of the insulation system; a reading as low as 5 megohms may be acceptable if related to a low voltage application. See Table 3 for recommended minimum insulation resistance.
CTG Reading
During the CTG measurement, the MCE tester applies an AC potential between phase 1 and the ground lead. Circuit capacitance of the insulation system is measured. This capacitance value reflects the cleanliness of the windings and cables. A buildup of contamination on the surface of the windings and cables results in higher capacitance readings.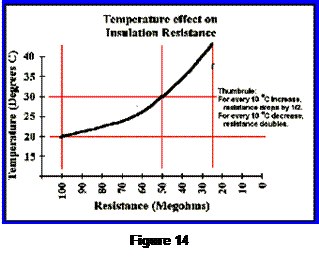
With a build up of contamination on the insulation surface, dirty windings and cables produce higher capacitance values than clean ones do. Over time, CTG values steadily increase, indicating an accumulation of dirt and that cleaning is necessary. This can be correlated with a lower RTG and higher CTG values.
This is important because dirt and contamination reduce the motor’s ability to dissipate heat generated by its own operation, resulting in premature aging of the insulation system. A general rule of thumb is that a motor’s life decreases by 50% for every 10°C increase in operating temperature above the design temperature of the insulation system. Heat raises the resistance of conductor materials and breaks down the insulation. These factors accelerate the development of cracks in the insulation, providing paths for unwanted current to flow to ground. The effects from temperature to insulation resistance can be seen in Figure 14.
Polarization Index and Dielectric Absorption
The Polarization Index (PI) and Dielectric Absorption (DA) are tests performed by the MCE on a deenergized motor. During the PI and DA tests the MCE tester applies a DC potential between the phase 1 and the ground leads for a pre-determined amount of time, ten minutes for the PI test and 30 seconds for the DA test. During the test, RTG readings are taken every second. Every five seconds, the average of the previous five readings is plotted on the RTG (megohms) versus time (seconds) display.
It is not necessary to perform a DA test if you are performing a PI test. When you perform a PI test, WinVis automatically saves the first minute as a DA test and the entire ten minutes as a PI test. When the test is complete, ratios for PI and DA are calculated.
Taking the RTG reading at ten minutes and dividing it by the one minute RTG reading calculates the PI ratio. Taking the RTG reading at one minute and dividing it by the 30 second reading calculates the DA ratio.
PI ratio = 10 min / 1 min
DA ratio = 1 min / 30 sec
The purpose of the PI test is to determine whether or not a motor’s insulation system is suitable for operation. The PI test is not limited to AC induction motors only. It also applies to wound rotor motors, salient pole machines, and certain DC fields. The DC field would have to have conductors that are fully encapsulated in insulation. Therefore, the PI test can be a worthwhile test for multiple type machines.
Polarization Index Correction
When performing a PI test, it is not necessary to temperature correct. Since the machine’s temperature doesn’t change appreciably between the one-minute and the ten-minute readings, the effect of temperature on the PI index is usually small. However, if the motor recently shut down and a PI test is performed, the results may be a substantial increase in insulation resistance. This would result in an unusually high PI, at which point additional testing should be performed once the windings have cooled to 40°C or lower.
Data Interpretation for PI and DA
In Managing Motors, Richard Nailen, P.E., offers the following guidelines shown in Table 4, for interpreting PI and DA ratios.

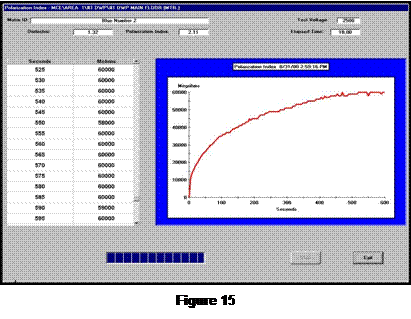 Excellent results should contain a PI ratio of 2 – 4, achieve higher than minimal RTG, and should be a non-sporadic rise in the megohm reading (Figure 15).
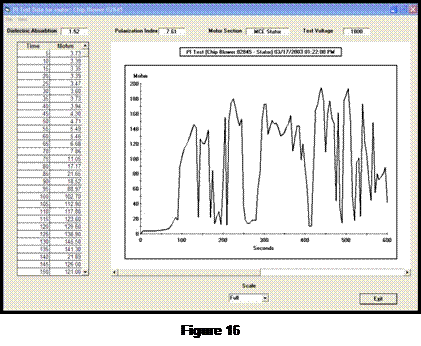 Erratic RTG values occurring at any time during the test is indicative of short-term current transients. These may be due to contamination or moisture. An important aspect in this situation is what level did the RTG values fall to. The IEEE minimum RTG value is 100 Megohm for form wound coils. The RTG values dip below the suggested minimum in Figure 16.
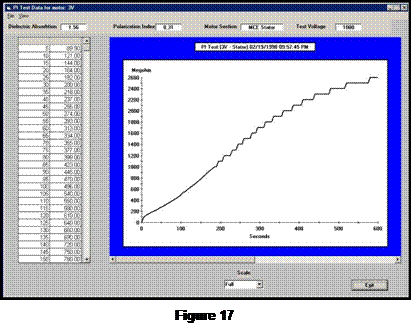 According to EASA’s Principles of Large AC Motors, it states that PI ratios of > or = 5 should be considered the result of dry or brittle insulation. This may be because of the age of the insulation or operating the motor at higher than designed temperatures (Figure 17).
PI and DA testing can both be used a single go-no-go, based on the minimum RTG readings established by IEEE 43-2000.
Conclusion
Compare the different MCE test results with each other and with other technologies. The more information you have to make a maintenance decision, the more confident you will be about your decision. Use all the technologies to maximize your troubleshooting efforts. As other technologies indicate faults, use the MCE to track changes in motor condition.
Part 4: Stator
The Stator Fault Zone is often considered one of the most controversial fault zones due to the significant challenge in early fault detection and the prevention of motor failure surrounding the stator windings. This challenge is further intensified in higher voltage machines where the fault-to-failure time frame becomes much shorter. The Stator Fault Zone is identified as the health and quality of the insulation between the turns and phases of the individual turns and coils inside the motor.
Failure Mechanisms
The likely mechanisms of a stator-winding fault are either a turn-to-turn, phase-to-phase, or turn-to-ground short. A turn-to-turn short is identified as a short of one or more windings in a coil. This can develop into a very low impedance loop of wire, which acts as a shorted secondary of a current transformer. This results in excessive current flow through the shorted loop, creating intense heat and insulation damage.
Due to the nature of a random wound design, a shorted turn could occur with much higher impedance, allowing the motor to run for extended periods of time before eventually destroying the coil with the high currents. As a result, it is not unusual to find random wound motors still running with bad stator windings. Form wound coils, however, do not exhibit high turn impedances and will therefore heat up quickly following the presence of a turn-to-turn short. A phase-to-phase short is identified as a short of one or more phases to another phase. This fault can be quite damaging due to the possibility of very large voltage potential existing between phases at the location of the short.
Analysis
The big controversy which surrounds the Stator Fault Zone is whether technology can give ample warning of an impending stator winding failure. The big problem with this discussion is often in the wording. “Will the MCEMAX find a turn-to-turn short?” is often how this is asked. The real question should be whether a technology can prevent a turn-to-turn short. If you keep a motor long enough, it will develop a turn-to-turn, phase-to-phase, or ground short. The goal of any technology, when faced with this type of long-term certainty, is to identify any conditions which may be conducive to these faults so they can be corrected. If the conditions conducive to faults are removed, then a longer life for the motor can be expected. If a turn-to-turn short has occurred, there is not a better tool to have than the MCE which will quickly verify this fault mechanism. Preventing a re-start of the motor may be the best thing at that point in the troubleshooting effort. Again, if you wait until the turn-to-turn short has occurred before you test the motor, you have waited too long.
MCE Analysis
The MCE applies a high frequency AC signal and a low voltage DC signal to the stator windings to perform stator analysis. From these signals, inductance and resistance measurements are taken for comparison between like coils and historical data. If you are testing a three-phase AC induction motor, comparison between the three phases is your most powerful tool. If you are testing a DC motor, then only a single phase exists and comparison to historical test data or identical motors would be effective. Inductance is a highly sensitive parameter and is influenced by many variables within the motor. Rotor condition, air gap flux, frame construction (iron or aluminum), and winding condition are a few of the variables. The most influential variable on the inductance reading is the winding condition. Specifically, the number of turns is a squared value in the overall inductance equation as seen below:
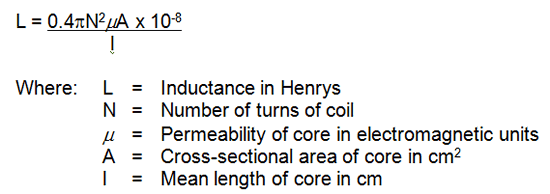
Although it is our goal to prevent a turn-to-turn short from occurring, you can see that a loss of a single turn in a stator winding will have a dramatic effect on the overall inductance of one or more phases based on the coil configuration. In our effort to identify the conditions that are conducive to a turn-to-turn short, we can use other variables in the equation to identify anomalies which could create stator problems.
Stator faults often end as a turn-to-turn short, but begin as something else. An example is a motor with excessive vibration, which results in winding movement, friction, and eventually worn insulation between the winding turns. Another example is rotor defects, which create intense heat on the winding surface and eventually create weakened turn insulation or even a ground fault. Core iron defects, such as shorted laminations, will also create additional heat, airflow disturbance, and elevated vibration due to imbalanced magnetic fields and air gap flux. What influence do these situations have on stator inductance? Other than vibration, rotor defects and air gap flux anomalies have a direct impact on the permeability (µ) of the stator windings. Changes in µ due to a stator core defect will create changes in inductance related to a specific group of coils located near the defect. Changes in µ due to rotor defects will have a varying influence on the stator inductance as the rotor position changes. A quick comparison of the inductance and inductive imbalance values between the three phases or to historical data will indicate changes in these variables and prompt further action or testing to be performed in an effort to prevent the turn-to-turn short.
EMAX Analysis
Stator analysis using EMAX technology is performed by evaluating the phase relationship of voltage and current for each of the three phases of an AC induction motor. These values are used to determine the impedance of each phase and display them as an impedance imbalance. Alarms show if the impedance imbalance exceeds a set point. Any change in the real or reactive component of one phase that is not duplicated on another phase will indicate a change that needs to be investigated.
One of the hurdles involved in this type of testing is acquiring this dynamic data at a load substantial enough to allow these values to be affected by the condition of the windings and not by the design. An unloaded motor may run with a current imbalance. This creates variations in the phase impedance, which duplicates indications of a stator fault. Therefore, it is important to have approximately 70% load or more to remove the design impact on these values. Testing should not stop at <70% load, but you must use the test data as comparison values only. A test today at 50-60% load compared to a test last quarter at 50-60% load is still a very informative test. The more test points you acquire, the more confidence you will have in the condition of your stator windings.
Another application of EMAX technology is the ability to acquire data on current through the start-up cycle of the motor. The motor is under the most stress during start-up and can give many indications of problems existing or developing. Stator defects, as in open or shorted turns, will be identified as a change in the amplitude of the in-rush current. The in-rush current is the highest amplitude of current seen through a start-up and occurs immediately after the motor is energized. This occurs due to the effective locked rotor condition, which the motor is in at start-up. Without rotor movement, the counter-electromotive force created by the rotor to reduce current flow in the stator does not exist. In fact, the in-rush current immediately following the start of a motor is not affected by load at all.
Whether at full load or no load during a start-up, the in-rush current will be the same. Only line voltage and circuit impedance will have an effect on the in-rush current. The current, which exists following the initial in-rush however, is greatly affected by the load. If only line voltage and circuit impedance will affect the in-rush current value and we generally expect line voltage to be the same, we must rely on circuit impedance as an indicator of stator health. Increased in-rush current results from lower circuit impedance and a decrease in in-rush current results from an increase in circuit impedance. Lower circuit impedance could be caused by weakened turn insulation or shorted turns. An open winding, high resistance connection or even improper repair specifications may cause higher circuit impedance. This is Ohms Law. Remember, significant temperature variations from one test to another will have an impact as well on the overall circuit impedance and should be considered when evaluating the start-up data.
Conclusion
Finally, it is important to remember that stator defects do not exist very long before they can become catastrophic. Use all the tools you have available, know the circumstances, and act quickly to dismiss or confirm stator fault indications. Remember, the goal of any technology in stator analysis is to identify any condition which may be conducive to a turn-to-turn short, so that condition can be corrected before a turn-to-turn short occurs.
Part 5: Rotor
Starting a motor with a broken or cracked rotor bar causes excessive heat to be generated in the vicinity of the broken bar. This can spread to other rotor bars and destroy the insulation around the nearby laminations. It can also affect other parts of the motor. What do we find just a few millimeters away from the rotor? The stator! Stator insulation cannot hold up to the intense heat developed by the broken rotor bar and will eventually fail. Unfortunately, many times broken rotor bars are not easily seen without technology and it may be missed as the root cause of failure. This may result in a motor rewind, and replacement of bearings, but not a rotor repair. When the motor returns to service, it has the same problem all over again, just with new insulation to destroy.
Rotor Design
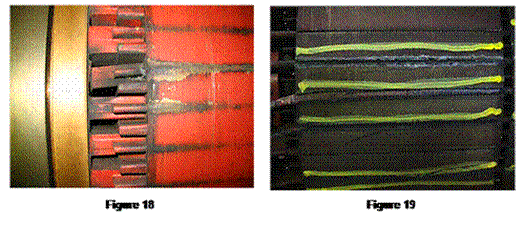
The design of the rotor plays a major role in the severity of an identified rotor anomaly. If the rotor is a closed bar design (Figure 18) the severity will be low due to the rotor iron acting to hold the broken rotor bar in place. However, if the rotor is an open bar design (Figure 19) then the severity increases significantly with the identification of a rotor defect. This elevated concern comes from the possibility of the rotor bar squeezing out of the rotor slot and contacting the stator.
Test Methods
Rotor Influence Check
One method of testing the rotor condition is the Rotor Influence Check (RIC). What is a RIC? RIC is a test performed by the MCE on AC induction, synchronous, and wound rotor motors, which illustrates the magnetic coupling between the rotor and stator. This relationship indicates the condition of the rotor and air gap within the motor.
The RIC is performed while rotating the rotor in specific increments (determined by the number of poles) over a single pole group and recording the change in inductance measurements for each phase of a 3-phase motor. For proper resolution, 18 inductance measurements per pole group are recommended. To determine the number of poles in a motor use the following equation:
 F = NP / 120
F = Line Frequency (normally 60hz in US)
N = Speed of the motor in RPM
P = Number of poles
Recalculated: P = 7200 / RPM
Example: A motor with name plate RPM = 1780 would have how many poles?
P = 7200 / 1780
= 4 poles
 Without historical data, a RIC must be performed to provide any information about the standard squirrel cage induction rotor. Faults such as broken rotor bars or damaged laminations can exist even if the balance of inductance is low. If you are basing the decision to perform a RIC only on how high the balance of inductance is on the baseline test, you could be overlooking late stages of rotor bar defect.
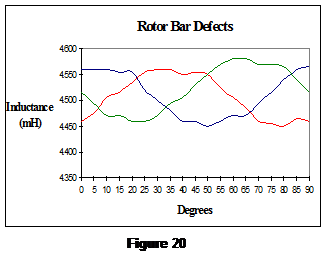
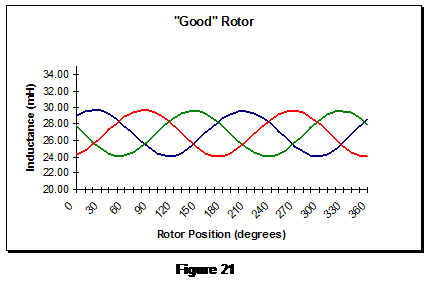
Figure 20 shows the expected inductance changes for a rotor with broken rotor bars. Note the erratic inductance values at the peak of the sine waves for each phase. Broken rotor bars cause a skewing in the field flux generated by and around the rotor bars. A normal rotor would have no skewing or erratic inductance patterns, as seen in Figure 21.
Numerous methods exist for rotor evaluation with the motor running. The EMAX test equipment, using in-rush, time domain, spectral, and demodulated forms of the current signal offer a broad approach to rotor analysis.
In-Rush/Start-Up
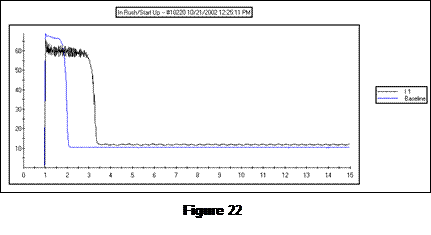 One method of evaluating rotor health is the In-Rush/Start-Up. Broken rotor bars create higher rotor impedance resulting in higher reflected impedance onto the stator driving the current and torque down. This can be seen in the before and after In-Rush examples in Figure 22.
(Fp) Sidebands
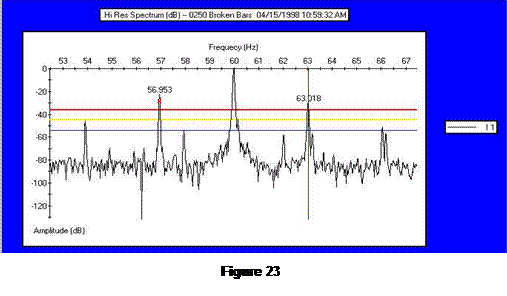
Another method is trending the pole pass sideband frequency (Fp) amplitude. Increasing Fp sideband amplitude is indicative of a modulating line current associated with rotor slip. This modulation is often due to a rotor cage anomaly. Trending the Fp sideband amplitude and determining the differential amplitude as compared to line frequency amplitude allows a predetermined alarm based on well known and accepted industry standards. Figure 23 shows an elevated Fp sideband peak above the 36dB differential from line frequency.
5th Harmonic
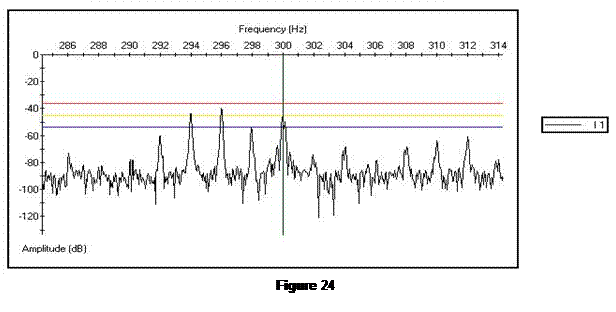
The third method of evaluating rotor health with the EMAX is the high frequency spectral analysis sometimes referred to as the Swirl Effect. Broken or cracked rotor bars create a phase shift in the air gap flux resulting in multiple Fp sidebands below the end of the 5th harmonic. Figure 24 shows these elevated sidebands beneath the 5th harmonic.
Current Demodulation
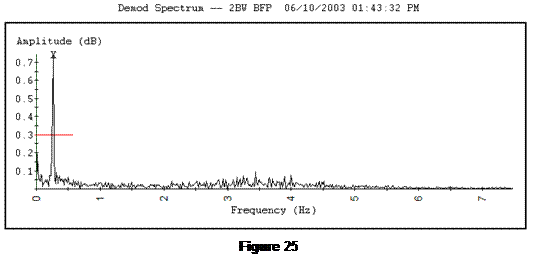
The fourth method of evaluating rotor health with the EMAX is the demodulated current spectrum. By removing the components of line frequency from the spectrum, the noise floor drops to a value allowing normally non-visible peaks to be visible. Relating to rotor health, it also allows a filtered view of the Fp in a demodulated spectrum form. Figure 25 shows the elevated Fp peak exceeding a predetermined alarm set point. This peak was associated with a broken rotor bar in a large 2-pole motor.
Conclusion
In a study funded by the Electric Power Research Institute, 10% of motor failures were caused by a rotor anomaly. This amounts to a large number of motors in even the average-sized plant. It is important to be aware of the rotor design, utilize the broad spectrum of test methods discussed above to correlate and confirm, and extend your motor life by fixing the cause, not the symptom.
Part 6: Air Gap
The Air Gap Fault Zone describes the measurable distance between the rotor and stator within the motor. Air Gap eccentricity is a condition that occurs when there is a non-uniformity in the air gap between the rotor and stator. When there is an eccentricity in the air gap, varying magnetic flux within the air gap will create imbalances in the current flow, which can be identified in the current spectrum. This unevenness in the space between the rotor and stator will affect the alignment of the Rotor Influence Check (RIC) results.
- Static eccentricity occurs when the centerline of the shaft is at a constant offset from the centerline of the stator. An example is a misaligned end bell.
- Dynamic eccentricity occurs when the centerline of the shaft is at a variable offset from the centerline of the stator, such as a wiped bearing.
Failure Mechanisms
By definition, air gap eccentricity is a mechanical fault within the motor. There are several possible causes for the presence of variances in the distance between a rotor and a stator. The five basic types of air gap eccentricities that can occur are:
- Rotor O.D. is eccentric to the axis of rotation
- Stator bore is eccentric
- Rotor and stator are round, but do not have the same axis of rotation
- Rotor and shaft are round, but do not have the same axis
- Any combination of the above
The following are only a few of the possible causes of an air gap eccentricity:
Improper mounting of the motor to its bedplate can lead to an air gap distortion. A loose or missing bolt allows shifting of the motor’s mounting foot during thermal expansion of the frame. This shifting over time could lead to a distortion of the frame and possible eccentricity of the stator. The common term for an incorrectly mounted motor is “soft-foot”.
During construction of the motor, out-of-roundness of either the rotor or stator will lead to an air gap eccentricity. Industry standards recommend that measurements for total indicated roundness (TIR) should be performed at different locations along the length of each of these components. Couple these measurements with the circumferences of each component and, depending on the speed and size of the motor, there are recommended tolerances from 5 to 20 percent variation in the air gap.
Eccentricity can develop due to improper tensioning of drive belts coupled to a motor. One customer working with PdMA’s technical support staff commented that while they were releasing the tension on one set of belts they measured the deflection of the motor shaft. The shaft moved over 1/8 of an inch! Improper alignment could also lead to a situation similar to this, with both leading to a bowing of the rotor during operation.
Distorted end bells, cocked bearings, or a bent shaft will all cause an air gap eccentricity. During the manufacturing of the rotor, uneven mechanical stresses could be introduced into the cage and lamination stack leading to bowing of the completed rotor.
An air gap eccentricity results in increased levels of vibration due to the uneven magnetic pull it creates between the circumference of the rotor and stator bore. Over time, these elevated levels of vibration can result in excessive movement of the stator winding, which could lead to increased friction and eventually a turn-to-turn, coil-to-coil, or ground fault. Additionally, this vibration can accelerate bearing failure, which could seize the shaft and overheat the windings or allow additional movement of the shaft leading to a rotor/stator rub. The uneven magnetic stresses applied to the rotor coupled with the increased vibration will also contribute to mechanical looseness developing in the rotor. Any of these occurrences could lead to a catastrophic failure of the motor, which could require a complete rewind and possible restacking of the iron.
Analysis
The easy part about analyzing a motor for eccentricity is collecting the data. The hardest part seems to be confirming what the data show and deciding what to do about it. This may be true for many of the fault zones, but there is no absolute standard on how much eccentricity indicated on a current spectrum is too much, with the exception of an actual measurement of the physical air gap. However, once the number of rotor bars is confirmed, PdMA has established guidelines and alarm set points to assist you in making the right decision. The same can be said for the results of a Rotor Influence Check (RIC). The graph indicates the presence of an air gap eccentricity, but without historical results for comparison, you really cannot develop a sense of how much eccentricity has developed and if it is getting worse with time.
MCE Analysis
Eccentricity analysis using the MCE is performed utilizing the RIC test and will be most successfully applied in troubleshooting if pre-existing RIC data are available. However, even without a baseline test, the RIC test will give you definite indications of an existing eccentricity.
Analysis of a RIC is done by evaluating the graph of phase-to-phase inductance for the following:
| Scale: Sinusoidal Y/N? | Characteristics: Rotor Damage |
| Alignment: Eccentricity | Peak-to-Peak Inductance: Eccentricity or Stator |
Phase-to-phase or turn-to-turn shorts will cause a separation of the three-phase sinusoidal RIC graph. The result is either a “two-up/one-down” or a “one-up/two-down” pattern. The pattern depends on whether the stator windings are wye or delta wound.
Air gap eccentricity impacts the alignment of the graph and the peak-to-peak inductance values of individual phases. Peak-to-peak variations occur on each phase or between phases, depending on the type of eccentricity. If it is static eccentricity, you may get equal peaks from pole group to pole group on the same phase, but the peak amplitude will be quite different between the pole groups of different phases. Simply put, the graph looks misaligned across the graph. If dynamic eccentricity exists, then peaks from pole group to pole group in the same phase will be different. In a 4-pole motor, the rotor is positioned 90 degrees to cover one pole group. When performing a RIC, the WinVis software will use the motor nameplate data to determine the number of poles and then inform the operator how many degrees the rotor needs to be positioned to cover the first pole group.
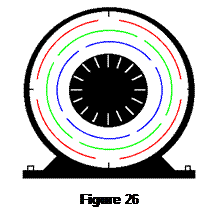 Concentric vs. Lap Wound
An important consideration when evaluating RIC data for indication of eccentricity is whether the motor is concentric or lap wound. If a motor is concentric wound, it is built with a pre-existing offset between the stator windings and the rotor.
The concentric wound motor seen in Figure 26 has the stator windings inserted into the stator slots in a basket form or stacked configuration. Commonly, all of the pole groups for phase A are laid into the slots, then all of the pole groups for phase B, then finally, all of the pole groups for phase C. This results in a greater distance between the rotor and the phase A coils than exists between rotor and phase C coils. This results in a natural stair-stepping indication of the phase-to-phase values seen in Figure 27.
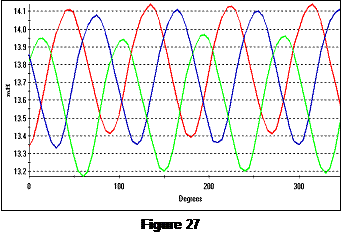 Concentric wound motors by design create RIC results that appear as though there may be an eccentricity between the rotor and stator. Results of a RIC performed on a random concentric wound motor can be seen in Figure 27. Notice the peak amplitudes from one pole group to another are basically the same, but different from the other two phases. One phase is always slightly lower and the other phase is always slightly higher.
In a case where concentric wound motors are identified or suspected, the RIC needs to be performed over two pole phases. Place the motor in observe, and confirm any suspected eccentricity with correlating evidence, such as EMAX eccentricity analysis or vibration analysis.
F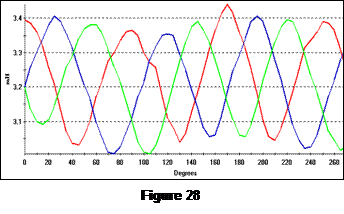 igure 28 shows an example of a dynamic eccentricity. Notice how the peak amplitudes of the blue phase vary from pole group to pole group as the rotor is rotated. This is occurring for each of the three phases. Dynamic eccentricity is the more severe type of eccentricity due to the increased chance of a rotor/stator rub.
EMAX Analysis
Eccentricity analysis using EMAX technology is performed through a high frequency spectrum of the current signal. When air gap eccentricity exists in a motor, the air gap flux will be off balance, causing different levels of voltage to be induced onto the rotor. This results in irregular current flow on the rotor and varying levels of counter electromotive force, which is felt by the stator. These varying forces on the stator windings produce changes in the amplitude of the current similar to a load change. By displaying the current in a spectrum format, the modulations can be seen as sideband activity around a location known as the Eccentricity Frequency (FECC). The FECC is the number of rotor bars multiplied by the shaft frequency (RPM/60) of the motor. The current modulations are seen as peaks on the spectrum, which will be first and third sidebands of the line frequency powering the motor. In a 60 Hz system these peaks will appear as 4 peaks, 120 Hz apart, and non-synchronous to line frequency. The peaks are seen in Figure 29.
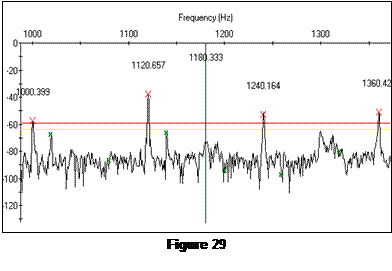 The large X’s indicate the eccentricity related peaks. The smaller x’s indicate harmonics of line frequency. The cursor line located at 1180 Hz is the FECC, which is equal to the number of rotor bars times the shaft speed.
One advantage the EMAX offers is that the technician may use alarm set points to estimate the severity of the eccentricity and act accordingly. However, speed and rotor bar information are necessary for the technician to be able to confirm that the peaks identified on the spectrum are indeed eccentricity related. If the number of rotor bars and the speed are known, the WinVis software automatically places a red X at the four peak locations that identify eccentricity. Obtaining the speed from the Advance Spectral Analysis (ASA) current demodulation software, Low/High Resolution rotor test or via a strobe light is the easy part. The rotor bar count, however, is another matter. First, at the earliest opportunity, you should verify that a rotor bar count exists on each of your motor repair specifications. The report you get back from the shop should include how many rotor bars and stator slots exist in the motor. Second, utilize the vibration department to assist in the rotor bar count. They may have previously identified the number of rotor bars through spectrum analysis of the vibration signal.
Conclusion
Eccentricities in the air gap will develop an uneven magnetic pull between the stator and rotor during operation. This uneven magnetic pull will lead to increased vibration, mechanical wear and tear, and possibly pullover to the point of a rotor/stator rub. It is important to have equipment which provides you with the necessary information to make informed maintenance decisions concerning the severity of an air gap eccentricity. The MCEMAX provides one easy-to-operate package for the evaluation of air gap eccentricity during operation or when the motor is secured. Giving you the capability to perform a RIC test and eccentricity analysis through the high frequency spectrum of the current signal, the MCEMAX uses a combination of both static and dynamic testing to provide the most comprehensive analysis of the air gap fault zone.
Advertisement


