Mark Goodman, VP Engineering
Adrian Messer, Presenter
UE Systems, Inc.
14 Hayes StreetElmsford, NY 10523
Ph: 914-592-1220 / 800-223-1325
Fax: 914-347-2181www.uesystems.com/new
Abstract
Ultrasound and Infrared are complementary technologies for generalized PdM activities. Ultrasound will “hear” what infrared might not “see”. Many IR thermographers are now incorporating ultrasound scans of enclosed electric cabinets as part of their inspection protocol to avoid potential arc flash incidents. Historically, predictive activities for both technologies cover more than just electrical inspection; they might include inspection of bearings, gears, and valves to name a few. While sound quality and trending amplitude changes are often the most common methods of identifying issues ultrasonically, there are many situations that will call for more detailed analysis to help determine the severity and type of problem. Ultrasound instruments are now capable of adding sound imaging through spectral analysis to enhance the diagnostic process. This presentation will examine ultrasound imaging for electrical, mechanical and valve leak diagnostics. The principles of spectral analysis as it relates to ultrasound inspection will be explained and clarified through case histories and actual examples of faulty bearings, gears, valve leaks, and electric emissions.
Introduction
Infrared thermographers use thermal images to help them spot irregularities as part of their diagnostic process. Ultrasound inspectors can use similar tools. While ultrasonic imaging techniques in terms of producing a clear “photo-like” representation are, at this moment, limited to the medical world, there are other techniques and methods that can be extremely effective in enhancing the diagnostic procedure.
Discussion
Audiolizing
The imaging method we call “Audiolizing” is based on the concept used by Olympic athletes in which they often visualize their event before they perform. For example, a weight lifter might close his eyes and visualize the motions involved with lifting the world record weight or a runner might review a track meet and what it takes to spurt to the finish line.
Audiolizing is a word that is not found in the dictionary. As with any predictive technology, in order to understand what constitutes an abnormal condition, an inspector must have an idea as to what is a normal or “baseline” condition. Therefore, Audiolizing is a technique in which an inspector, based on knowledge of the equipment being tested will imagine what a good operating condition would sound like. If something different is heard the inspector can imagine what the problem might be.
As an example, try this exercise. Imagine a good bearing. It is properly lubricated and aligned. There are no faults. What type of sound would you expect to hear? Most often it would be a smooth rushing sound similar to an air leak.
Now imagine a fault, let’s say pitting. What could this sound like? It would be a crackling sound.
While this approach can be considered a “subjective” method, it is a viable approach. At times being “subjective” can be extremely useful and can often lead the way to an accurate diagnosis and game plan.
This concept is used on an almost daily basis by many of us. We are all familiar with our own particular means of transportation, most commonly the automobile. Most of us drive one every day. We become familiar with the typical sounds it generates as we drive around. If anything changes, we become aware of it. It alerts us to listen more carefully and more “objectively”. If we investigate the sound, based on our understanding of where the sound is and the mechanics involved to produce that sound, we can make an accurate diagnosis. If we are still uncertain, we can then incorporate the use of more technical, “objective” equipment such as an automotive systems diagnostic computer.
Standard PDM Approaches
The concept of diagnosis by “Audiolizing” can be enhanced with additional tools such as spectral analysis. Spectral analysis can be performed with standard vibration analyzing instruments or with software that can be installed on a PC. Sounds can be recorded and played back for review in either a spectral view or in a time series view. Using the same concept as described above, based on the knowledge of a specific test subject, an inspector can “Audiolize” and “Visualize” a typical “good” condition and then understand what might be wrong if another sound or “image” is viewed.
Vibration analysis often employs the use of a sound spectrum or a time series to view faults in equipment. By adding sound to these views, defects can become easier to understand and diagnose. The advantage of adding ultrasound to these views provides an even clearer “picture” of the problem and in many cases, when connected to a typical vibration analyzer will speed up the sample grabbing process.
Below is an example of what enhancement ultrasound can add to a typical vibration time series view.
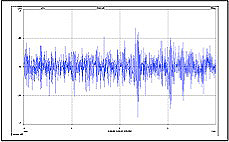
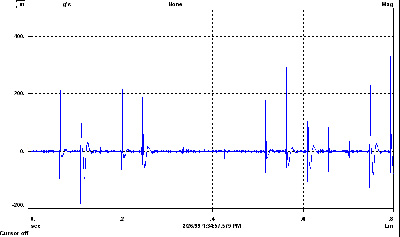
The following time waveforms were taken on identical gearboxes in a tubing manufacturing facility. There are 6 gearboxes coupled together each driving tooling that bends steel to form tubing. An inspector was out collecting data with a vibration analyzer and an Ultraprobe ultrasonic translator when he came across these gearboxes. The vibration time waveform was taken using an accelerometer. When listening to the gearboxes with the Ultraprobe, most of them had a “hissing” type sound. One gearbox had a “ticking” sound to it. A time waveform was captured using the accelerometer and then using the Ultraprobe ultrasonic translator. These were then compared to the gearbox right beside it. The following time waveforms show the results:
|
Gearbox A |
Gearbox B |
|
 |
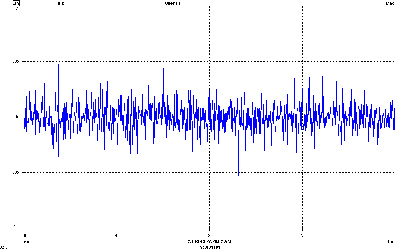 |
By comparing the two time waveforms, you can see that there is a slight difference in the two gearboxes. Now when you look at the following time waveforms that were captured with ultrasonics, the problem becomes more defined.
|
Gearbox A |
Gearbox B |
|
 |
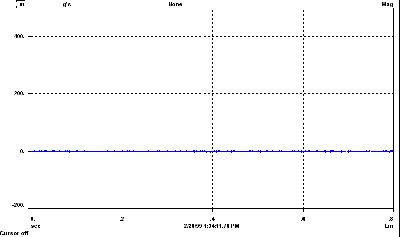 |
The ultrasonic time waveforms shows the broken tooth or teeth in gearbox A. By the use of ultrasonics this problem was caught in an earlier stage.
This is another way of using a “sound image” to improve the diagnosis.
Spectral Analysis Software
With the introduction of spectral analysis software, a similar type of diagnosis can be performed on a standard Personal Computer as long as the PC has a sound card. These programs not only provide the spectral and time series views of sound but enable users to hear the sound samples simultaneously as they are viewing them on the PC monitor. Typically a sound sample is recorded using a mini-disc or tape recorder. Some ultrasonic instruments have on-board sound recording, which can be downloaded to a PC via a Compact Flash Card. When played back in real time, the acoustic properties can be analyzed. Based on a known “good” or “normal” condition, an anomaly can be quickly determined.
By combining the concept of “Audiolizing” with the sound sample, a diagnosis.
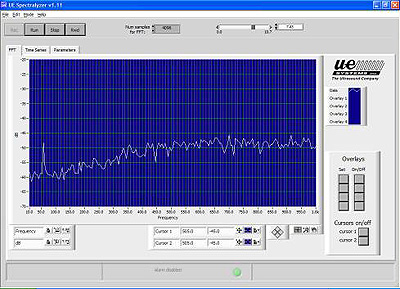
The following is an example of a good bearing. If one were to imagine the sound a good, lubricated bearing makes, the sound quality would be a smooth, “rushing” sound. Here is a sample captured on Spectral Analysis software:
|
Good bearing Spectra view |
Good bearing Time Series view |
|
 |
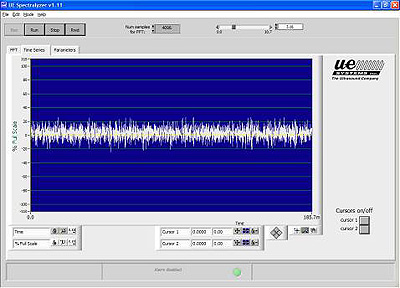 |
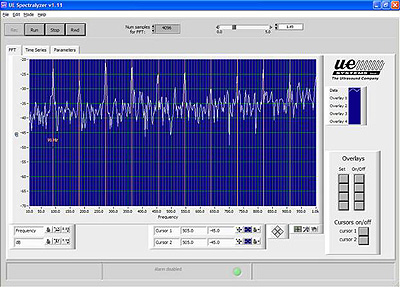
Note there are no distinguishing characteristics. You are hearing and seeing an example of “white noise”. Now let’s view a bad bearing. There has been a shift from the expected smooth, rushing sound produced by a good bearing. A fault has occurred in this high-speed bearing. The difference is noted two ways, a shift in the sound quality from a nice, recognizable rushing sound to a jarring buzzing noise. Observe the change in acoustic quality in the spectra view below. Note the fault frequency has been captured as 90 Hz harmonics.
 |
The advantage of ultrasound inspection, aside from providing a finer resolution for viewing the sound image, is inspections can go beyond what is possible to do with typical vibration or infrared scans. By combining the auditory sense with the visual, it is possible to enhance the diagnostic process for evaluating the condition of electrical equipment that might not be detected via standard infrared imaging. |
Reciprocating compressor valves are very noisy and produce a lot of extraneous vibration. By isolating the sound with the advantage of the short-wave nature of ultrasound, it is possible to listen to and view the sounds of these noisy valves in real time and to determine a leaking valve. How would you imagine the sound of a “good” compressor valve? As it opens and closes there will be a definite, pronounced clicking. What about a bad valve?
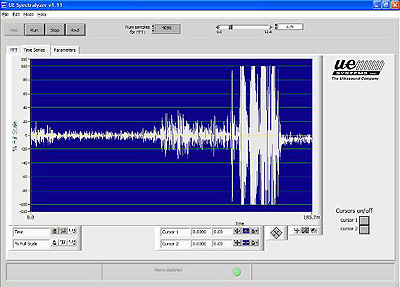
Here are two samples of compressor valves viewed in the time series. Which is the bad valve, the one on the left or the one on the right?
 |
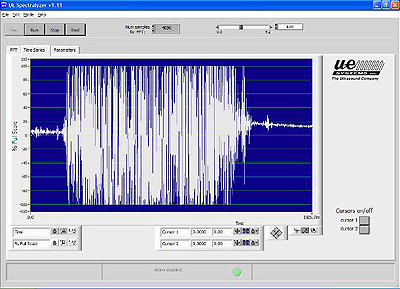 |
The sample on the left has a definite closed period followed by a distinct “open” period. The view on the right shows a very long “open” period. Therefore the leaking valve is the sample on the right. If one were to listen to these samples as they were viewed, the conclusion would be very obvious.
Electrical Emissions
Below are some examples of typical electrical emissions. Again, the advantage of being able to hear while the sound sample is viewed can help an inspector understand the type and possibly the severity of the condition. Using the concept of Audiolizing, imagine what a steady electric emission would sound like and then imagine what the irregular sounds produced by arcing would sound like.
Some preliminary experimentation has demonstrated that the main harmonic of an electrical emission (60 Hz in the USA, 50 Hz elsewhere) will be most prevalent in corona. As the condition becomes more severe, there will be fewer and fewer 60 Hz harmonics observed. As an example, arcing has very few 60-cycle components. Mechanical looseness will be “rich” in 60 Hz harmonics and will have little frequency content between the 60 Hz peaks and will also demonstrate harmonics other than 60 Hz.
When possible, listen to the sound characteristics as they are played in the Spectra View and note that the harmonics of 60 Hz diminish as the condition becomes more severe.
This is a view of Corona. Note the steady display of 60 Hz harmonics with a lot of frequency content between the spikes.
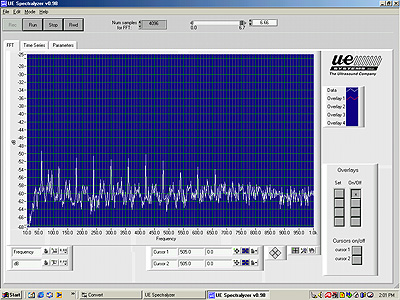
If one were to listen to corona as the sound sample was being played, it would have a distinct “buzzing” and crackling noise.
Tracking, sometimes referred to as “destructive corona” has a different acoustic property. This type of emission has a rapid build up and discharge called “baby-arcing”. Using the “Audiolizing” concept, what do you imagine this would sound like? Probably popping noises. Below are sound samples viewed in the spectral view.
Note the harmonics of 60 Hz have diminished in this tracking example.
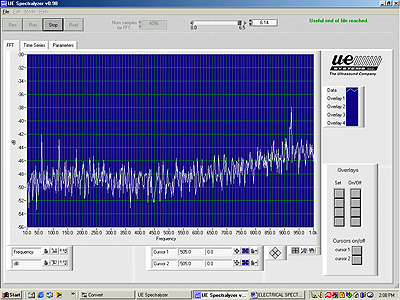
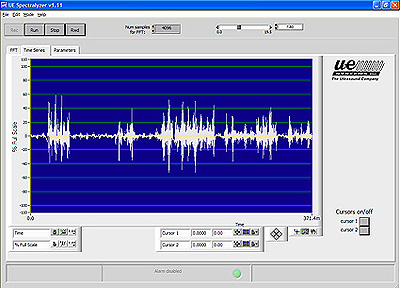
Below is another view of the tracking sound as seen in the “time series”. If you were to imagine the “popping” sounds, they can be seen as the long, vertical lines in this view.
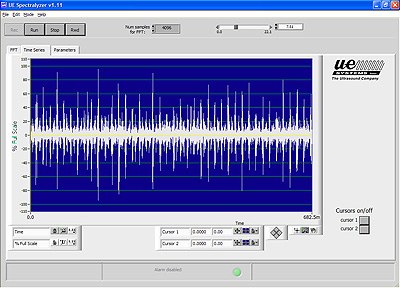
What do you think arcing would sound like? Here is an example.
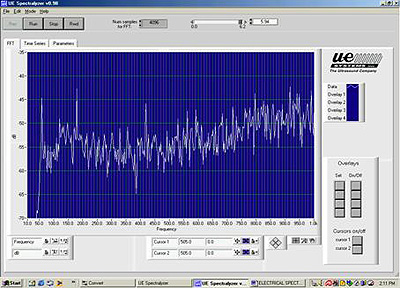
Note the irregular starts and stops. You’ll also notice very few harmonics of 60 Hz are present. Arcing will contain almost violent starts and stops. Using the “Audiolizing” technique, can you imagine these starts and stops? The time series view below might help complete the sound image.
Images of Lubrication
As the concept of “Predictive” lubrication versus time-based (“Preventive”) lubrication has emerged, there are times when it is useful to use spectral analysis combined with “Audiolizing” as a teaching aid. Instead of lubricating bearings on a routine, “time- based” schedule, inspectors can routinely test bearings and identify those that need lubrication, leaving the others alone. In this manner, lubrication technicians can be taught how to effectively apply just enough lubricant to prevent over lubrication.
When a bearing has exceeded a baseline by 8 dB with no change in acoustic quality, the bearing should be lubricated. While applying lubrication, the technician should stop when the sound level has dropped to the pre-determined baseline level.
A way to demonstrate this process is to view a sound image while noting changes in amplitude and listening to acoustic properties in real time.
Below is a spectral view of a sound sample taken while a bearing was being lubricated. The top, red overlay is the non-lubricated state. Note how the sound level drops as the lubricant is applied.
What sound quality would you expect to hear for this “good” bearing?
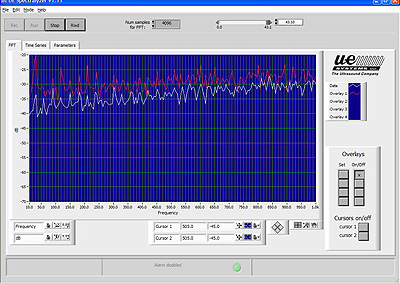
As the proper lubrication level is reached, the decibel level drops by 8 dB with no change in the sound quality. There are no distinctive harmonics or spikes, only a representation of the “white noise” sound quality we would expect to hear if we were to listen as this sound sample was played.
Report Enhancements
While issuing reports, it is important to include as much data as possible to help others understand and accept your conclusions. Details such as the specific equipment tested, inspection techniques, inspection equipment used and conditions found, including recommendations, are standard items that must be included in a report. The report can be enhanced with digital photographs of the equipment and arrows indicating the location of specific anomalies (if any). Trend graphs, such as the sample shown below will also be very useful. In addition, the use of your sound images will be very helpful in describing and supporting your results. If possible, it might be useful to include “before” (i.e. “normal”) spectral or time views as well as the current sound images. If you issue a report digitally, attaching a WAVE file of “normal” versus “current” sounds can help drive home your point.
Samples that can be included with your report
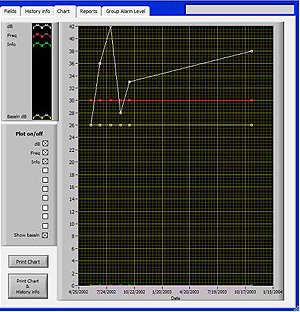
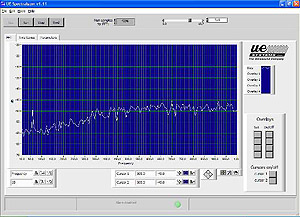
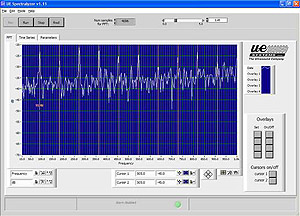
Bearing 123-A Trend to Failure
 |
 |
|
|
Bearing 123-A Good Spectra |
Bearing 123-A Failure Spectra |
Conclusion
The more tools we can use while inspecting equipment, the more effective our results. Predictive maintenance requires an integration of technologies and techniques for accurate diagnosis. Knowledge of how equipment operates will enable an inspector to anticipate the sounds of a normal “good” condition and therefore determine a potential problem when there are acoustic anomalies such as changes in sound quality or in amplitude. Relying on sound properties alone can be too subjective. By incorporating analytical methods such as spectral analysis, software inspectors are able to enhance their diagnostic accuracy and provide an element of objectivity to the process.


