Infrared “Knowledge Management”
Scott Cawlfield
Logos Computer Solutions, Inc.
3801 14th Ave. West, Seattle, WA 98119
206-217-0577
Abstract
I learned about “Knowledge Management” from a corporate speaker at an insurance company’s team building retreat. It did not really sink in until we did this exercise. There were 5 teams and each had to build a rollercoaster from paper, cardboard, toothpicks, and tape. The winner was the team that kept the marble on the rollercoaster the longest before hitting the floor.
One team won the competition and that team was labeled “consultants”. The winning team members were divided up equally and placed on the 4 remaining teams. Now the objective was to build another rollercoaster with the same type of materials. The only difference was that each team would gain the “Knowledge” from the consultants and their previous experience.
The object was that every team had to stay up longer than the previous winning time. By openly sharing knowledge, every one of the teams learned from the previous mistakes and successes and every team was able to build a better rollercoaster.
Working in the infrared industry is a continual learning experience. Hopefully, some of the information shared in this paper will help you build a better rollercoaster with fewer mistakes.
This paper will discuss:
2. Tips on route building
3. Tools to automate data collection and report generation and how to maximize their benefit
4. Looking at the trends in the infrared industry, how they can affect you, and how you can capitalize on them
Data to Cost Justify a New Infrared PdM Program
The hardest part of starting an internal infrared program is justifying the cost to buy the camera, software and to train personnel to do the infrared inspections. The manager’s standard question is “What is the Return on Investment (ROI) for implementing an infrared program?” Justifying the Return on Investment numbers for a new infrared program can be a very time consuming and daunting task if you don’t know where to get the information. You can look at other companies’ business cases as an example, but if there are none available, then you must look internally.
A good place to start is to look at the computerized maintenance management system (CMMS) used to track your inventory, work orders, purchasing and a whole lot more. Some common CMMS software names are Maximo, Passport, SAP, etc. Some companies keep data in differing degrees regarding equipment failures, root causes of the failures and the cost of the repairs completed. If you are one of the lucky ones with this information, this is a potential gold mine for justifying a new infrared program. One example of how to do this is as follows:
| 1. | Sort all the equipment failures for one year into mechanical and electrical equipment. We will focus only on electrical equipment since it is easier to work with than motors or rotating equipment and is typically the “low hanging fruit” for a new infrared program. |
| 2. | 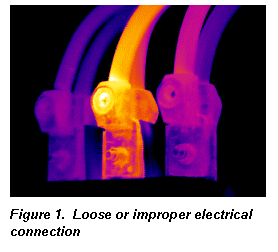 Total up the cost of all the electrical equipment. Don’t include the labor cost for the repair – just the equipment replacement cost. Always use the lowest equipment replacement cost when there is a range of replacement costs.We will leave off the labor cost to replace the failed equipment since this will offset the labor cost to fix the “loose or improper electrical connections” on the equipment before it fails. This “repair before failure” generally falls into the category of “disassemble, clean, and retighten to manufacturers specifications” and is a relatively inexpensive fix. Total up the cost of all the electrical equipment. Don’t include the labor cost for the repair – just the equipment replacement cost. Always use the lowest equipment replacement cost when there is a range of replacement costs.We will leave off the labor cost to replace the failed equipment since this will offset the labor cost to fix the “loose or improper electrical connections” on the equipment before it fails. This “repair before failure” generally falls into the category of “disassemble, clean, and retighten to manufacturers specifications” and is a relatively inexpensive fix. |
| 3. | Since 67% (on average) of electrical equipment failures are due to “loose or improper electrical connections”(1), take the total replacement cost of the electrical equipment and multiply it by 0.6. This is a good ballpark figure to start with since infrared is an excellent PdM technology that can find “loose or improper electrical connections” before they burn up or blow up the equipment. |
| 4. | Next, take this total and cut it in half (or whatever you feel comfortable with) since you might not find all the problems before they fail, but you might conservatively be able to find half of them. |
| 5. |
Now ask the question: Is this cost avoidance total enough to justify starting an infrared program? With this cost avoidance total, will an infrared program pay for itself in 6 months, 1 year, or 2 years? (the ROI question). This calculation is extremely conservative and most importantly, can be verified by the company’s accountant. Remember, this is only a small part of the ROI picture. We did not even consider loss to production, downtime, safety or other mechanical equipment costs. Even though these other pieces of the ROI puzzle are usually much greater in numbers and totals, they are also a potential source of disagreement or disbelief, so we don’t include them in this calculation. |
Now, if your company does not keep this information on equipment failures and costs, or you need some additional cost avoidance numbers, look at what preventive maintenance routines your company currently maintains. For example, two preventive maintenance procedures to look at closely are:
| 1. | Tightening all electrical connections once a year. Although this is meant to be a preventive measure, many electrical connection problems have been caused by this approach. |
| 2. | Changing out equipment before it fails even if it does not have a problem. |
For example, a company used a preventive maintenance approach to their 600V starters and replaced them every year whether they needed it or not. Since it was very costly to have a 600V starter fail during production, this expense was justified. Once the infrared program was established, they changed their replacement frequency to once every 3 years. This saved the company an enormous amount of money.
Look at what preventive measures your company is doing now and see if infrared, which is a non-contact, non-destructive testing method, can improve and compliment your existing preventive maintenance procedures.
Even if your company runs all equipment to failure, infrared can at least give a heads-up on what equipment has a problem or is about to fail and let the company order the spare parts to have on hand.
For existing or mature internal infrared programs, giving upper management cost avoidance or cost benefit analysis figures on a regular basis is extremely important. Many thermographers or PdM managers don’t have the time or the resources to gather these cost avoidance numbers together in a report, but the lack of these reports to upper management has caused many infrared programs to be reduced or shut down.
Infrared is an invisible technology, both literally and figuratively. When an infrared program is mature and running smoothly, many in upper management hardly know it exists. They are just happy they have few plant failures and a high production output. But when it comes time for cutbacks, the infrared and PdM programs are usually one of the first targets on the list to trim. Without cost avoidance reports to justify the infrared program, upper management sees the infrared program as just a “Cost of Goods Sold” entry reducing their “bottom line”.
On the other hand, with conservative cost avoidance reports, an infrared program might cost the company $250,000 a year while it saves the company $1,500,000 a year. Now upper management sees the infrared program as a “Profit Center” rather than a “Cost Center” and is much less likely to cut back on the program. This is why it is especially important to generate cost benefit analysis reports or cost avoidance reports on a regular basis as an internal company thermographer or outside consultant. If you don’t show your worth in $$$, it could cost you your job or client.
By finding problems before they burn up or blow up, infrared thermographers save companies hundreds of millions of dollars a year, yet they usually don’t get the recognition for these cost avoidance savings. For more information on cost benefit analysis or cost avoidance, see (1).
Route Building Tips
Once you have started your internal infrared program, the next question are “What equipment should we test?” and “How often should we test it?”
The easiest “low hanging fruit” for a new infrared program and a new thermographer to find is testing electrical equipment. Circuit breakers, disconnects, starters, transformers, etc.
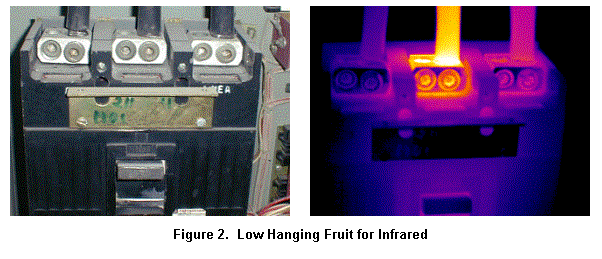
Now, not all equipment is created equal. Instead of listing out your 3,000 pieces of equipment in your plant and dividing these into routes with equal testing frequencies for the year, a more efficient approach is to categorize your equipment into 3 categories of Critical, Essential, and Non-Essential equipment. By asking the question: “If this equipment fails, what will happen to our production?”, you can quickly categorize your equipment list.
For internal corporate thermographers, evaluating what is most critical to your business process and inspecting these pieces of equipment first and with the highest inspection frequencies will give you the best use of limited resources. On a limited budget and resources (which everyone seems to be on), it is better to inspect the most critical pieces more often than to try to inspect all the equipment in a plant in a certain timeframe.
Start small and focus on the most critical equipment first and then add the most problematic equipment next since it is said, “that 80% of your problems happen on 20% of your equipment”. To climb a mountain, you must do it one step at a time. Once you find your 20% of problematic equipment, you can add them to your high frequency routes. Your CMMS system is potentially a great resource to find historical problems. If your company records equipment failure information in your CMMS system, you can answer the following questions:
2. Where was it located in the plant?
3. Is one equipment manufacturer having more failures than other equipment manufacturers?
If you don’t have access to equipment failure histories, this information can be gathered over time.
How to Expand Testing and Routes for Mature Infrared Programs
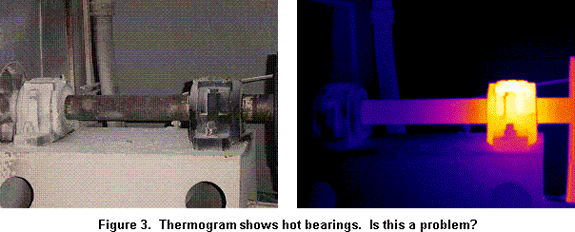
Many companies only scan their electrical equipment with infrared because they have other technologies to test motors and other rotating machinery. One of the strengths of infrared is it can quickly see heat differences on mechanical equipment in a non-destructive, non-contact testing method. Very much like a video camera that sees heat differences, infrared is a very fast and efficient method to scan many pieces of equipment quickly for thermal anomalies (if you know what you are looking at).
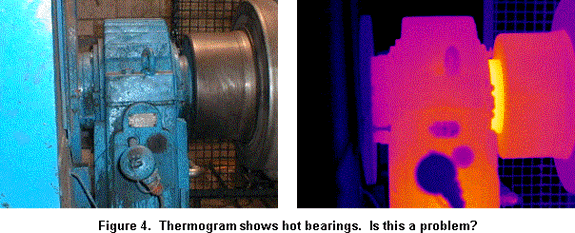
By baseline trending motors and bearings, infrared can watch over time and quickly scan a large volume of motors looking for abnormal heat signatures. Unfortunately, infrared frequently cannot tell you what the problem is, only that there is a potential problem. This is where vibration, motor circuit analysis or ultrasound can be used as complimentary PdM technologies to diagnose the actual problem. This is one way you can maximize your infrared investment and capitalize on the strengths of infrared.
Automating Infrared Inspection Reports
One of the biggest time saving improvements both internal corporate thermographers and third party thermography inspection companies can make, is the automation of the inspection and reporting process. Besides infrared cameras, thermographers are one of the most important resources a company has and a large part of their expense, so utilizing their time wisely is very important. For an 8-hour inspection day finding 20 problems, it will take the thermographer, on average, 2 to 4 hours to generate a report.
So, a thermographer who does 120 days of IR inspections per year can take up to 60 days doing reporting and paperwork. In this competitive infrared environment, most third party inspection firms cannot charge for report generation. So if they charge $1,000 a day for IR inspections, that is $60,000 in unbillable time going to inspection reports. If you can reduce your report generation time from 4 hours down to 20 minutes, however, you can reduce that 60 days a year down to 4.5 days. Now what you do with those extra 55 days is up to you. You can do more inspections, take some time off, or spend more time with your family.

Figure 5. Buried in paperwork?
Tools to Automate Your Report Process
Many camera manufacturers have upgraded their software to make it easier to automate the reporting process. If you don’t have the latest camera manufacturers’ software, see if this will benefit you. This is one way to speed up and automate your reporting process. Even if you don’t have an automated reporting system, you can still take a computer laptop out in the field with you and give a preliminary report to the customer with your report software or MSWord and/or burn the report to a CD. At least the customer will have a preliminary result from the IR inspection with the final report to follow later. With a preliminary report delivered, sometimes you can invoice the customer right away and speed up your cash flow even though they haven’t received the final report.
Beyond documenting the anomalies you find in the field and, as is mentioned later in the paper regarding doing infrared scanning for insurance companies, you may be required to keep an equipment inventory list. The paper method is very simple but not very efficient and does not utilize some of the technology available today. Another approach is to record your data, track inventory inspection status and generate reports electronically – with a tablet computer or PDA in the field. The general trend for computers has continued to be smaller, lighter and cheaper. You are going to have to put all this inspection data into a computer to produce the reports eventually, so why not start entering it during the inspection? For inventory control, you can use Microsoft Excel for your inventory list on your computer and take it out in the field with you on an 8 oz. Personal Digital Assistant (PDA). PDAs come standard with MS Excel built into them on the Microsoft Pocket PC platform.
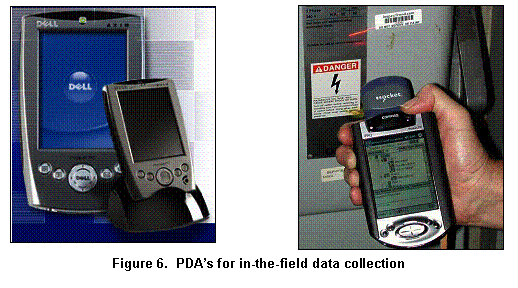
By updating from a paper method to a PDA in the field, you can effectively cut out double entry and possible transcription errors when you translate your information from paper field notes back into the computer. This can save you time and money while increasing your accuracy. There are also commercial infrared inspection packages available that will run on tablet PC’s and PDA’s that will automate and improve your inspection efficiency while also reducing your paperwork and report generation time. Some commercial programs cover the complete workflow process from inspection scheduling, inspection inventory, problem documentation and reconciliation, baseline trending, bar coding and report generation. Also, some programs even have integration with CMMS systems like Maximo and web managers to access the reports over your LAN or Internet.
Another benefit from automating your inspection reports is that if you can do them in 20 minutes, you can leave the report with your customer at the completion of the job. The customer no longer has to wait 1 to 4 weeks to get the report back. This is a significant differentiator between companies that can do this and those that can’t. With the current computer technology, the trend is to create the reports on a laptop in Adobe Acrobat format (.pdf) and burn the reports onto a CD at the customer site. Now the customer has the reports as soon as the inspection is done and they can start the work order and repair process. The printed copy of the reports can be sent later if the customer wants a printed copy. Some companies are not requiring a printed copy when they have the reports on a CD. This can save on printing costs and time. Also, with automated report generation, you can speed up your cash flow by invoicing the customer when the inspection is done, instead of waiting 1 to 4 weeks when your final product, the inspection report, is shipped.
Trends: Computers and the Internet
How do trends and advancements in computers and the Internet affect a thermographer? Well, to start, access to information and knowledge transfer. This is the information age and there are web sites with all kinds of educational information accessible from a computer connected to the Internet. Information on infrared standards, news groups with current information on new camera technology, message boards and chat rooms where you can ask a question and another thermographer across the country may have the answer for you, are fairly easily accessible to us all. For example, you can review sample image pairs and look through the message boards at www.Flir.com.
Another area of growth in the Internet is the connectivity of people and information at your fingertips. These web tools are changing things dramatically. Infrared reports are viewed and analyzed over the Internet and intranet (local area network of a company). Managers want to go to one place to see their data and utilize a web enabled solution allowing them to tap into the network that connects most companies together internally and externally, locally, regionally and even internationally. Can you, other engineers or managers access your IR data and reports from anywhere in a plant; from any plant within the enterprise; from anywhere in the world? Being able to create a library of thermal results and reports, to trend items over time for engineers to monitor, to produce cost justifications that accountants can see on their web browsers immediately, will set you or your company apart from the pack. This is where trends and advancements in computers and the Internet will play a big part of the growing future of the infrared industry.
Trends: The Insurance Industry
Another trend in the industry is the growing education, awareness and success of infrared as a PdM technology. Many companies are realizing the huge Return on Investment (ROI) savings and improved production from implementing infrared inspections. This is especially true for insurance companies. Insurance companies pay out millions of dollars for claims each year and many of these claims are investigated. What they have found is that many of these claims are preventable by using infrared to identify problems and fixing the problems before they blow up or burn up. By comparing claims data of their insureds that have an accountable infrared program against those that don’t, the insurance companies have realized a major difference. When infrared inspections were done properly and accountably AND the problems identified were fixed before they burned up or blew up, they found dramatic cost savings for their insureds and themselves from a reduced number of claims.
As this education trend grows, and more and more insurance companies realize the cost savings of using infrared, they are requiring their insureds to have accountable infrared inspections done as a basis for underwriting the insurance policy. This is great news generally for the thermography business, but it is a double-edged sword for the thermographer. Those who can capitalize on this trend by doing the inspection work required by an insurance company or by becoming a preferred infrared provider for an insurance company, can potentially increase their business without a lot of additional marketing.
On the other hand, the insurance companies will expect you to keep a comprehensive inventory list of what you have and have not tested. With this new knowledge in the insurance companies, you might also be held responsible if you don’t do a thorough and accountable job in documenting your work. Especially in cases of a fire breaking out on the equipment you previously inspected.
“Risk Engineers” are the best suited to see the benefits of infrared for their insureds while reducing the risk for themselves. You might need to sell the benefits of infrared testing first and then see if you can become one of their preferred infrared providers. Insurance companies are generally in the business of selling insurance and reducing their risk factors. Some insurance companies will provide their own internal infrared inspection services, others do not. For those companies that don’t want to provide infrared services for their insureds, this is a natural opportunity for established infrared thermographers to fill the need.
Summary
Infrared is a powerful tool that has many uses and applications. Considering the ups and downs of industry, relevant information is a key factor to the growth and acceptance of infrared in this market. As we learn and share information in the infrared industry, this field will continue to develop and mature.
Any feedback you have regarding this paper or your personal infrared stories are always welcome.
References
(1) “Cost Benefit Analysis of Infrared Programs”; Sandy Sanor – Hartford Steam Boiler Thermography Services and Scott Cawlfield, Logos Computer Solutions; Published in Maintenance Technology, June 2001. p. 14.
Acknowledgements
Thanks to all the thermographers who have openly shared their horror stories with me as well as their successes in this industry. As this infrared industry continues to grow and mature, I hope this sharing of information will continue for the betterment of all.
Advertisement


