Calibration and R&R Practices for Reliable Temperature Measurements
G. Raymond Peacock
Temperatures.com, Inc.
Southampton, PA 18966-3836
Abstract
There are many resources available to help one learn about calibration but few that talk to the practical issues, the practices involved. This talk will discuss traceability and practices used in establishing reasonable calibration uncertainties for temperature-measuring Thermal Imagers and IR Thermometers. The related, very important subject of R&R testing (automotive QA people know the practice as Gage R&R) applies both in the calibration environment and in the field. So it, and one way to conduct a statistically sound R&R test will be presented, too, with examples.
Introduction
Let’s put this topic into a little perspective. It’s not all dusty dry and boring. Some of it may already be impacting your business, or soon will, big time.
Last year, at IR/INFO 2004, Mike Sharlon gave a talk entitled: “Simplified Calibration of Radiometric Equipment”. In it he reviewed some of the essential, practical issues about calibration of temperature-measuring thermal imagers, such as:
-
What is calibration?
-
History of calibration
-
Why calibrate in the first place?
-
Calibration Standards, certificates, frequency and typical costs
At the same meeting, I gave a talk about confidence limits in temperature measurements. The conclusions were:
1. Temperature measurements made with thermal imagers are like any other measurement – they have built-in errors.
2. There are well-established methods for assessing such errors and reporting measurement results with confidence limits to meet the users expected measurement confidence levels.
3. It is in your best interest to practice good measurements in order to responsibly qualify your measurement capability and measurement results with confidence factors that can enable you to meet the expectations of your customers.
There are some significant issues here, and the bottom line is, if you don’t pay attention to them, you could well lose business to your competitors who do.
More and more government and industrial manufacturers are requiring traceable calibration in equipment used to assure that they are obtaining reliable results. This talk is about a few practical practices available that can help you to keep your equipment in calibration and, even more importantly, how to assess its performance in the field as a system comprised of equipment and operator.
Most people are not equipped with the proper hardware and training to perform even routine calibration checks. However, that know-how is readily available, usually under the guidance of the company that made your equipment, or someone you hire to routinely certify calibration accuracy, or uncertainty.
Discussion
Calibration Traceability Requirements
All calibrations, calibration checks or verifications must be performed with traceably certified instruments and sources such as blackbody thermal radiation sources. To do less in the infrared business is a waste of time and is essentially meaningless. There are some fixed point blackbody equivalents available, such as the NPL developed ear thermometer check source. Some blackbody manufacturers are planning to make low cost, simple sources useful for routine checking.
This is also an area where the buyer must beware. A critical fact to remember is the 4:1 minimum ratio required to do a reasonable calibration (check). That is, the reference source needs to be at least 4 times better than the device you are checking, e.g., if you want to check to an uncertainty of ± 2°F, your reference needs to have an uncertainty of at least ±0.5°F, or else you are wasting your time. A reference source with an uncertainty of ±5°F can only be used for checking the uncertainty of a test device to within ±20°F. Obviously, knowing what your requirements are will help you establish the requirements for a check device.
If you did not receive a traceably certified calibration certificate with your thermal imager, you may be dealing with the wrong, and possibly incompetent, supplier. It’s that simple.
They may know electronics, infrared and jargon, but if they do not know about traceable calibration in either radiometry or temperature, they do not know measurement. They are not doing you any favors by not supplying a certified, traceable calibration certificate with the equipment you purchased.
To be fair, not all vendors have been receiving requests for these certificates. So, being first businessmen and not educators, they supply only the minimum needed to make a sale. In my opinion, the supplier who tells you the truth, whether you understand it or not, is the more honest one. They are likely to also be the more competent and the more customer-satisfaction driven supplier than some of the competition. So, it is still “Buyer Beware”.
If you report temperatures or temperature differences with your imager, you are reporting the results of measurements. Many process manufacturing companies, government facilities and electric utilities have staff specialists who understand calibration, its role in measurement and the need to use vendors who are also aware.
You have to understand the basics, too, and be measurement-honest. It is no crime to report a potential problem based on your opinion, but if you hang a temperature number on it, be prepared to defend it. The only technically correct and accepted answer in measurement is that your equipment is maintained according to manufacturer’s recommendations. Moreover, the calibration is maintained traceable to national or primary standards by an unbroken chain of evidence as witnessed in certificates from capable vendors.
Calibration Practices
Organizing and making routine calibration checks is a straightforward activity that can be done by anyone using a bit of common sense and logic. Basically, you want to verify or continue to have assurance that your equipment works properly and is still traceable to national standards and/or primary standards.
If you are not able to justify a blackbody for routine checks, that should not dissuade you from performing them; there are other ways to “skin the cat”. The only tricky part is to establish the first traceability link. After that, it’s a matter of ingenuity, regularity and periodic rechecks on the traceability.
You need three different practices for successful calibration maintenance: first to establish and verify traceability of your reference source; second, to link your routine tests to your traceability; and third, to perform the regular checks on your equipment. That means three sets of records, and if you are serious about surviving a customer or other third party QA audit, a written procedure for each practice.
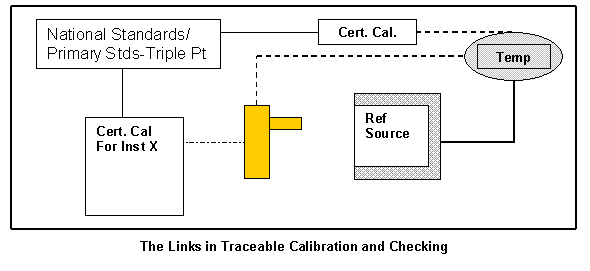
Written practices are a carefully thought through description of what to do and who does what in performing calibration. The depth and detail of each is dependent on how well you need to you train your staff (yourself?) to follow a checklist. That list tells the things to do and the order in which to perform them. Key in the practice must be the information on data to record, how it is measured and the acceptable range of values.
In a complete QA documentation system, every Practice document should be identified by a unique number, date or the current revision value. These documents are indexed in a master QA index of documentation relating to the organization’s overall practices and procedures with current copies kept in a central QA documentation file, binder or folder.
Certificates and Records
Getting and keeping traceable calibration for your equipment, to repeat, has only three components:
1. Begin with a certified calibration certificate that spells out the traceable measurement uncertainty of your imager system(s) and regularly recheck it.
2. Regularly check at one or more points over the measurement range of your imager system so that you know it remains within the calibrated uncertainty range.
3. Keep permanent records of all the checks and events related to the calibration and repair history.
Obtaining the first link with your local reference source can sometimes be expensive. It need not be, if your equipment maker provides it routinely, as some do.
If you have two IR devices, both certified and demonstrated stable, it is possible to compare them using a stable temperature source of unknown emissivity. If one drifts, you have no way of proving which device has changed. If you have a third device, then a comparison between pairs will quickly show which one has changed.

One way to achieve this state of relative certainty with only one thermal imager is to use a source of known temperature (using a traceable, certified thermometer, RTD or thermocouple with indicator) and unknown emissivity, and a lower cost, certified spot IR thermometer. The thermometer and imager can be compared with each other by viewing the source and they both can be compared with the thermometer. There will, of course, be a difference between all three readings, but that difference should remain constant if the conditions do not change and the measuring devices are stable.
It’s a bit easier with two imagers or an imager and two spot thermometers. The same principles apply; compare differences between pairs of devices for the same source. If the reference source is a high quality blackbody with a certified thermocouple, RTD or glass thermometer imbedded in it, the job should be much easier, but the equipment much more expensive.
There are many resources available showing how to organize your calibration records and practices to keep track. They can be as simple as keeping an index card record for each device referencing the essential data. A log book, a computer spreadsheet file or an elaborate database system will also do the same job. Here’s a simple tabular layout that captures most of the significant data.
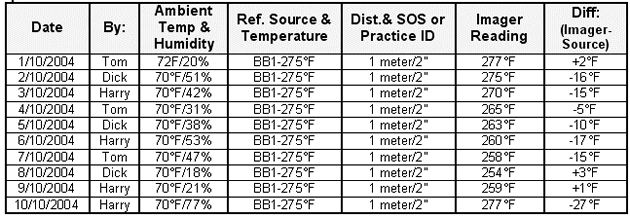
Cal Check History, Imager RayCon Model 782, SN/AF-210568 Ref Initial Cert. NIST #20588.
Can you tell what is missing from this data that you would like to have included or should be included as part of a good measurement practice?
Is this device in calibration at any time? Does the data suggest anything to you? Perhaps if the calibration history data was also plotted, the graphical record may highlight something else, not readily seen in the tabular form. A plot versus time shows little.
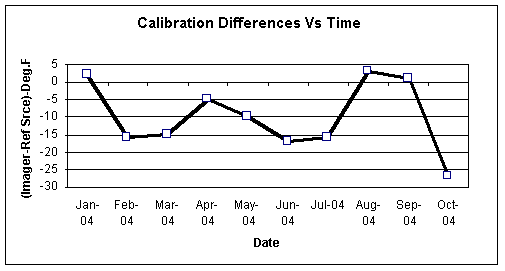
You could analyze it using Control Chart methods, but there’s not much to see, except that perhaps a trend is being established between April and June (three points in the same direction is indication of a trend in Control Charts). However, it reverses in July. In addition, there are no control limits on the chart. What would be your criteria for determining if your device was out of calibration? What are those limits?
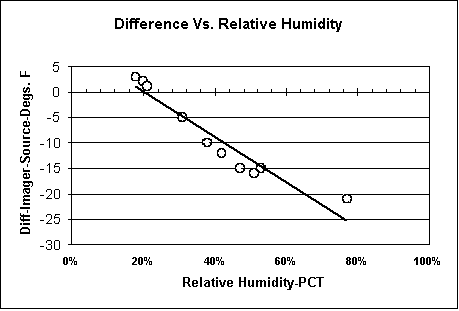
In this fictitious case, a graphical plot of the temperature difference versus the ambient relative humidity shows clear humidity sensitivity in the calibration. Does your device have a sight path humidity correction? Is it tuned correctly? There’s more to calibration checking than mere collection of data.
You need to observe many trends and learn from them, if at all possible.
You also need to establish for each imager a calibration uncertainty range, within which the device is considered in calibration. You need to have a practice for the checks, the sighting distance, the source size and most importantly, a record of results with all important information entered. An R&R test can be very helpful in learning a true tolerance range. The minimum is the calibration uncertainty.
Gage R&R
You may also get asked to answer the $64 million, question: How much is your imager affected while in field operating conditions or in the “Real World”?
Is it still traceably calibrated under those conditions? Do the operator’s capabilities and equipment sensitivity affect the results when the camera is used in the field? If so, by how much and how do you know that?
Do you know? Why do you know? Do you have confidence that your testing is sufficient to provide a repeatable answer?
If you cannot demonstrate that you, with your equipment and/or your staff members with equipment, are capable of obtaining repeatable results, then your data is not worth publishing. You are just plain better off not reporting temperatures.
R&R stands for Repeatability and Reproducibility. It is so widely practiced in the dimension gaging field that it has come to be known as Gage R&R. If you Google that term, in quotes, you will be overwhelmed with tons of resources and links to software sellers and beyond. R&R principles apply to all measurement devices, including thermal imagers, because they are used outside the test or calibration lab environment, often by people who have a variety of skill capabilities.
Controlled Tests to Characterize your Imager
There are two ways to develop an understanding of how well or poorly your imager performs under field conditions; controlled tests and uncontrolled tests. If you try to do testing in the field, you are usually doing uncontrolled tests because many of the influencing variables are usually not under direct control, such as wind chill, radiant loading, air humidity and ambient temperature.
It is far, far better to learn your imager’s temperature measuring capabilities under simulated field conditions, such as performance at the extremes of the ambient temperature range. A lab test enables a change to only one influencing factor at a time.
Few people are set up to perform all the tests they would like, but most of the really important ones are easier to control than you may think. For example, sight path length or air humidity sensitivity of instruments may be learned by monitoring the conditions prevailing during regular calibrations and recording data about variables, such as relative humidity and imager ambient temperature. Most equipment manufacturers do these tests also and can provide you with factual data on the results, if you request them. You have a much better chance of getting the data if you request it before you make a purchasing decision.
Some makers may not test as thoroughly as others, and you may have to talk with several before you find who does the best job. Still, if you can’t learn everything that you need you may have to seek outside help.
R&R Tests
The performance R&R test is about the only one that combines the uncontrolled variables related to both your measurement device and the properties of the people, the thermographers, using it. The testing methodology is well-developed by automotive and mechanical parts businesses and are well known by them. In fact, my first introduction to this type of testing came while trying to determine how well process-line inspectors in a steel mill could measure the width of cold, flat, steel strips using tape measures.
Everyone in the plant “knew” that experienced inspectors using traceably calibrated tape measures should readily average a ±1/32” (±0.03125”) measuring capability using tape measures graduated in 1/16” increments.
It turned out that successive repeat tests proved that as a group they could not do better than ±1/8” (±0.125”) or four times worse than expected or assumed. That was quite an eye-opener and led to the revamping of the mill’s Inspection Methods with a new measuring device and practice that would reliably yield better than ±0.03125”. It eliminated the use of the tape measures as QA test apparatus.
Similar testing can be performed with many measuring devices and while there are few written guidelines published for IR temperature measurement equipment, they are not very difficult to develop.
Here’s a sample R&R test procedure that we also developed at another steel mill. In their Instrumentation Shop, we had three different blackbody thermal radiation sources and a written calibration check practice. It is not simple, but not very complex either. The only difficult part is the calculations, and there are dozens of companies with software to do the job, if you do feel up to it.
The four technicians in our case used the same instrument in turn to make measurements on the three sources. Then we repeated the entire measuring sequence twice more.
The procedure is straightforward. Use three to five constant temperature test objects, each at distinctively different temperatures within the expected range of practical measurements, and one common piece of equipment to perform the measurements. The actual temperature of the sources does not need to be known, what counts is the variation in measured results. However, it is good to keep track to be certain that sources do not vary appreciably during the measurements.
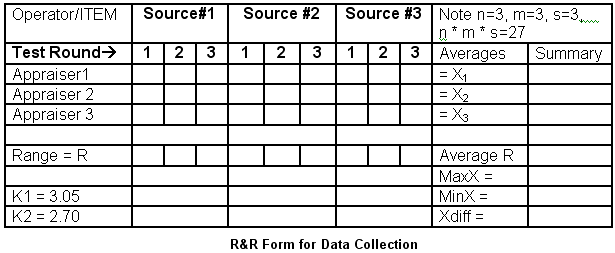
Have an operator (appraiser) measure and record the temperature of each object. Then repeat with the next operator, and the next, and so on. The entire measurement sequence is repeated two or three times. If enough operators are not available, repeat the sequence as if there were. Enter the data on the form below, if you do not have the software, and calculate according to instructions. You can even measure a one person appraiser effect by re-doing the test yourself as the only appraiser once after breakfast, once before lunch and then after lunch. Give yourself a different ID each time.
R&R can be expressed several ways from the resulting data, as an R&R value (overall variability index), as an equivalent standard deviation value and as a percentage of the allowed tolerance in measured values.
Numerically, R&R value can be found from the equation: R&R2 = EV2 + AV2 , where EV is the Equipment Variation and AV is the Appraiser Variation. This is the familiar root sum of the squares method for combining different statistical sources of error. It says that the R&R is the square root of the sum of the squares of the two effects.
Equipment Variation or Repeatability of the Imager, in the language of statistics, is EV. It is the average range of results multiplied by a statistical factor, K1, that depends on the number of retests of each sample. For three retests, K1=3.05, for four tests, K1=2.5, for two tests, K1=4.56. However, the number of sample temperatures times the number of appraisers must be greater than 15.
Reproducibility is the Thermographer or Appraiser Variation, called AV. It can be expressed numerically in several different ways. Clearly, there needs to be more than one appraiser performing the tests, or the results are AV=0.
To calculate AV, one first calculates the average measured temperature by each appraiser on each source. Then, subtract the smallest from the largest, yielding a value called Xdiff.
Xdiff is multiplied by another statistical factor called K2, where K2 depends upon the number of appraisers. For 2 it’s 3.65, for 3 it’s 2.70 and for 4 it’s 2.3.
That product is squared and is reduced by a numerical value related to the Equipment Variation. This number is the square of EV divided by the product of the number of operators and the number of different sources.
AV is then the square root of the difference between the two calculated values. It can be expressed in a messy-looking formula:
AV = Square root of ([Xdiff * K2] 2 – [EV2 /(n * m * s)])
Given a measurement Tolerance for your imager, the Percent R&R is the expression of the measured R&R value divided by the tolerance, expressed as a percentage. Typically, the minimum Tolerance for a temperature measuring device is the greater of the manufacturer’s accuracy specification or the stated traceable calibration uncertainty.
Conclusion
That’s it in a nutshell. The key to familiarity is to try it several times, use the software or a spreadsheet template. Several are available for under $100 from reputable vendors. If you look hard enough on the Web you may find some free resources to augment the NIST/SEMATECH e-Handbook of Statistical Methods described last year and listed in the reference section below.
I hope this has been a little more rewarding, if not too daunting, than last year. The math is not very hard and there’s software available that does it all. It is better if you understand the principles and some of the calculation methods involved so that you can easily spot any outrageous numbers and correct mistakes before they go too far.
References/Resources
Nicholas, J.V. and D. R. White, Traceable Temperatures Second Ed., John Wiley & Sons, Ltd., 2001.
Taylor, B. N. and C. E. Kuyatt, NIST Technical Note 1297: Guidelines for Evaluating and Expressing the Uncertainty of NIST Measurement Results, National Institute of Standards and Technology, US Dept. of Commerce, Gaithersburg, MD, 1994.
(On the web at: http://physics.nist.gov/cuu/uncertainty/index.html).
AIAG-Automotive Industry Action Group, MSA-3 Measurement Systems Analysis (MSA) Third Edition for Automotive QS-9000 Suppliers, 2002. (Can be purchased by telephone from AIAG Customer Service department at 248-358-3003 or on the web at: http://www.aiag.org/publications/quality/iatfquality.html). Automotive Industry Action Group (AIAG), 26200 Lahser Road, Suite 200, Southfield, MI 48034.
Engineered Software, Inc., Measurement Assurance (Software supporting the analytical techniques detailed in the Automotive Industry Action Group (AIAG) Measurement System Analysis Manual), Engineered Software, Inc., 43737 Timberview Drive, Belleville, MI 48111
(On the web at: http://www.engineeredsoftware.com)
Croarkin, C., Editor, Measurement Process Characterization, Chapter 2 in the NIST/SEMATECH e-Handbook of Statistical Methods, National Institute of Standards and Technology, US Dept. of Commerce, Gaithersburg, MD.
(On the web at http://www.itl.nist.gov/div898/handbook/index.html).
Advertisement

