
Wayne Swirnow
Level III Certified Infrared Thermographer
Infrared Imaging Services, LLC
PO Box 221New City, NY 10956Ph: 845-641-5482www.infraredimagingservices.com
Abstract
Infrared imagers are a form of data acquisition equipment having operational specifications and limitations similar to many other forms of test and measurement instrumentation. In all cases, the instrument’s function is to capture an external stimulus (voltage, pressure, G force, weight, radiant energy, etc.) and convert it to a qualitative graphical display or quantitative numerical measurement for the user. Through a deeper understanding of how the imager works as a piece of data acquisition equipment rather than just a “camera”, the thermographer will gain a deeper understanding of its capabilities. This paper will explore several key operational and performance specifications of thermal imagers and interpret them as they apply to their daily use in thermography.
Introduction
All instrumentation performs some or all of the following five functions:
-
Acquirethesignal-Voltage,pressure,flow,Gforce,weight,radiantenergy,etc.
-
Show it to you visually – Convert input to a qualitative graphical display. Imagers use intensity or color graded displays
-
Show it to you numerically – Quantitative format with numerical values predictably proportional to the input
-
Perform advanced analysis – Histograms, plots, trends, averages, areas, difference, etc.
-
Output the quantitative and/or qualitative information – Data files, images, reports
The capability of any instrument and how well that piece of instrumentation can perform the above tasks is conveyed to the end user through the product literature. This product document usually contains two types of information:
The first type of information tends to be very QUALITATIVE in nature, disguised to be authoritative and is usually written by the marketing department. It details the “virtues” of the product and states the value propositions of why it is good for you to buy it. While it can be informative by narrating the feature sets and benefits of the instrument, it is designed to sway your purchase decision in favor of the vendor’s product over all others, regardless of the actual performance specifications. Statements made in this section of the datasheet should be considered opinions, not facts.
The second type of information found in the product literature is the specification section; this is the QUANTITATIVE part of the literature. Here is where the manufacturer communicates, in a numerical format, the finite operating characteristics of the instrument’s measurement capabilities. This is the only area where performance characteristics can be evaluated.
In the best case, specifications are not and should not be open to interpretation; however, they can sometimes be misleading, often unclear, and not necessarily transferable between one instrument manufacturer to another for similar instruments and specifications.
It is critical that a purchaser or user of any measurement instrument knows how to read and understand its specifications so that when the device is selected to perform a task, it is matched to the desired application and used well within its operational range.
Specifications and Functions
All instruments have their top line specifications or “Banner Specs“. Banner specs are the ones which make it to the top front page of the literature; they are the ones which first come to mind when thinking about a product in any one market segment. When thinking about high performance automobiles, the banner specs which come to mind first may be horse power or 0 to 60 mph times. For a home theater system, it would be watts per channel. For a TV, it’s the number of inches. With imagers, it’s usually number of imager pixels and thermal sensitivity at the top of the list. While these are two important specifications, to fully understand the entire operational envelope of the instrument and if it suits a given application, it is necessary to read beyond banner specs and dig deeper into the specification set of the instrument.
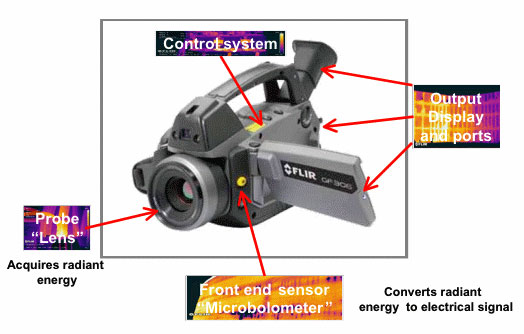
Regardless of the type of measurement instrument, if it is used to acquire real-world signals and display to the user an image or number which is representative of and proportional to the original signal, it will have many components and signal paths in common. Each component will add its own contribution to the product’s specifications. Some of these signal path components are:
-
A component designed to capture and conduct the real-world stimulus into the instrument, such as a lens or probe
-
A “front end” sensor to receive the real-world signal from the lens or probe and convert it to a proportional electrical signal (current or voltage)
-
An analog to digital converter to change the analog electrical signal from the sensor into a digital representation of the input
-
The control system / computer which controls the instrument and converts the digital data into pictures for qualitative analysis, numbers for quantitative analysis, or both
-
An output device such as display screen, monitor memory card or computer ports
The above functionalities may be located on multiple devices within the instrument or partially integrated into single chips. Typically for signal noise issues sensor chips are isolated but may have the A to D build into it. Other control processors are usually separate circuitry.
With regard to the specifications, consider that every component in the signal path makes a contribution to measurement error. Each individual component in the chain has its own performance envelope or margin of error and therefore the overall product specification is the sum combination of all hardware / software error and calibration capability. In addition, specifications for measurement equipment are typically stated as being measured under a fixed set of conditions. For radiometric imagers it may be with blackbody simulators, placed perpendicular to the lens at a reference ambient temperature, typically 30C. The real world performance of the equipment may vary depending on the environmental conditions of the application it is used in.
Imager Design System Components
All components in the signal path contribute to measurement inaccuracy and are reflected in the product specs
Probe
In the thermal imager and non-contact radiometer, a lens serves as a probe for these devices. Lens specifications usually consist of the spectral band pass of the lens as in short (SWIR), middle (MWIR), or long wave (LWIR) infrared and the lens field of view in degrees such as 6, 12, 24, 45, 90, etc. As an alternative, they may also be specified by focal length such as 38mm or 50mm. Lenses are made from a variety of materials and coatings which are transmissive to the spectral frequencies the lens is designed to pass. The opening of the lens or “F” stop may be expressed as f/1.8 or f/2.4, etc. where the smaller the number, the larger the lens aperture.
Due to imperfections in the coating and materials or by design, the lens may not pass radiant energy linearly within its band pass or uniformly across the surface of the lens. These imperfections may allow a greater or lesser amount of radiant energy to reach the sensor chip from that lens area. Therefore, each lens is a unique device and must be calibrated to the camera it is being used on if measurements within specifications are to be achieved.
For most applications, selecting the spectral range you wish to work in and the field of view of the lens are the two lens specifications we are usually concerned with. Camera manufacturers have a preselected assortment of lenses matched to specific cameras and our choices are usually limited to the field of view we want.
Front End Sensor
In the imaging radiometer, it is the detector which takes on the role of the front end sensor. The remainder of this paper will be dedicated to the detector and specifications around its performance. The detector is the device which receives the radiant energy from the lens and converts this energy into an analog output which is proportional to the received energy. The most popular banner specifications which relate to detectors are the number pixels, expressed in terms of an array size (120 x 120) and sensitivity. Also associated with the detector are the specifications of accuracy and resolution.
Detector Size
|
Specification name: |
Resolution, Image Format, Fully Radiometric Pixels, Detector, Detector type |
|
|
Definition: |
Quantity of pixels on the sensor, more generally results in finer image visually, and depending on the lens, smaller spatial resolution, lower IFOV, smaller measurement spot size |
|
|
Expression: |
Detector array dimensions or number of pixels |
|
|
Example: |
Arraysize = 120×120;120×240;240×360;480×640 |
Detector Sensitivity
|
Specification name: |
NETD (Noise Equivalent Temperature Difference), Sensitivity, Thermal Sensitivity, Thermal Resolution |
|
|
Definition: |
It is the amount of radiant energy that would be needed to equal the internal noise of the detector such that the signal-to-noise ratio is equal to one for a given F Stop. It is the minimum temp change difference the instrument can resolve |
|
|
Expression: |
Number in mK, @ Reference temperature in oC |
|
|
Example: |
0.05 oC (or 50mK) @ 30 oC |
Accuracy
|
Specification name: |
Accuracy, Temperature Measurement Precision, Measurement Accuracy |
|
|
Definition: |
IThe degree of closeness of the measurement system achieves to that quantity’s actual (true) value ± |
|
|
Expression: |
+/- Number of degrees oC or +/- % of the reading, whichever is greater |
|
|
Example: |
+/- 2 oC or 2% of reading whichever is greater |
Accuracy is a compound specification, meaning that there are two components which need to be evaluated together in order to determine which component is applicable to the value being measured. On the low end is the absolute specification of ± 2 oC. This states that the imager is allowed to have an error which can be as much as 2 oC either plus or minus from the actual value. However, on the high end of the measurement scale, this same ± 2 oC would be beyond the accuracy of the imager. For example, at 1000 oC, a specification of ± 2 oC would be guaranteeing the measured values would fall between 1002oC to 998 oC or within 2% of actual, which is beyond the ability of the instrument.
In order to compensate for errors associated with increasing measurement values, a second component is added that expresses in terms of a percentage of the measured. Using the same example as above with the +/-2% threshold, values can be reported between 980 and 1020 and still be within specifications. It is up the user to interpret the specification correctly and determine which component applies to the value being measured and to use the greater one.
As applied in the thermal imager and many other measurement devices, accuracy and sensitivity have an interesting relationship. Knowing where to apply each one can greatly influence the work one is able to do. If the application states that the absolute temperature measurement of an object is required, then it is the accuracy specification which dominates the ability to derive a correct answer. In this case, the best one could hope for is to be within ±2 oC or ±2% of measured value regardless of how sensitive a detector may be.
In the situation where it is important to know the temperature of one object relative to another like object in a similar environment, then it is the sensitivity specification which dominates the measurements. One can reliably measure very small differences in temperature between two like objects in similar load/conditions if it is not necessary to know their absolute temperature value.
Detector Resolution
The word “resolution” has already been used several times to describe the performance of imaging radiometers. Here, it will be stated once more in a discussion of resolution in terms of detector / lens limitations to discern and detect radiant objects.
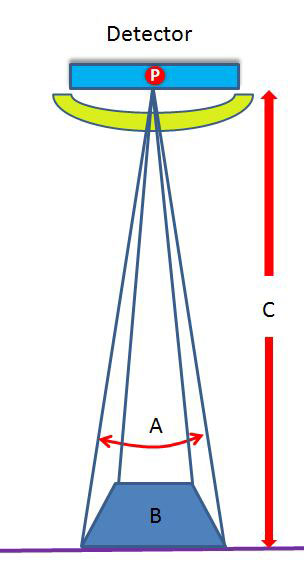
The detail discernible in an image is dependent on the spatial resolution of the sensor and refers to the size of the smallest possible feature that can be detected. Spatial resolution of passive sensors depends primarily on their Instantaneous Field of View (IFOV). The IFOV is the angular cone of visibility of the sensor (A) and determines the area on the target which is “seen” from a given distance at one particular moment in time (B).
The size of the area viewed is determined by multiplying the IFOV by the distance from the target to the sensor (C). This area on the target is called the resolution cell or resolution footprint and it determines a sensor’s maximum spatial resolution. For a single feature to be detected, its size generally has to be equal to or larger than the resolution cell. If the feature is smaller, it may not be uniquely detectable as the pixel will read average brightness of everything it sees. However, smaller features may sometimes be detectable if their radiance dominates within a particular resolution cell allowing sub-pixel detection.
A thermal resolution threshold test was developed to determine the cell’s ability to see a target – it is called the Slit Response Function or SRF. SRF was designed to provide the viewing angle in milliradians where the imaging system could detect 50% of the radiant energy detected by a blackbody simulator. Using this info, one could theoretically calculate the minimum target size where there was a 50% probability of detection answering the question of how large my target needs to be before I have a 50% probability of detection.
The “probability of detection” level is not usually thought about much in general thermography. If we see it in the imager’s viewfinder, it’s there. If not, it doesn’t exist. However, in the military world, when determining if a target will be visible or not, the probability of detection concept is very important (think incoming missile) so having a specification based on an actual defined level of radiance measurement rather than a theoretical one is more practical and sets expectations more accurately than a using a value derived solely through calculation and somewhat disconnected from the real world.
The two measurement methodologies, calculated IFOV and SRF derived IFOV, yield different measurements both expressing their results using the term “IFOV”. The “IFOV” angle derived from the SRF test is not always differentiated from the “IFOV” angle as calculated by pixel size and lens FOV. Furthermore, if SRF was used, at what radiance level was the SRF test conducted? What was the target shape and what was orientation of the detector to the target? These are usually never stated in imager datasheets. It may not be evident to the user which method was used to express the
Spatial Resolution Specification. In the interest of specification accuracy and understanding, perhaps a recommendation would be that IFOV as determined by the SRF measurement be called IFOVSRF because the value in this specification is derived by actually measuring the radiance levels through the measurement system and to use “IFOV” for representing the calculated value method.
There is a term called IFOVmeas, which considers that multiple IFOV elements are required to make a measurement, therefore is always larger than the IFOV value and is more representative of the actual spot size required for an accurate measurement, but radiance levels, target shape and orientation are not clearly specified.
In addition, IFOV has been referred to as Spatial Resolution or “the smallest detail that you can get an accurate temperature measurement upon at a set distance”. While a single IFOV resolution cell, which is also commonly called the “Spot size”, does contain a radiance value for that cell, imaging radiometers typically require more than one cell to guarantee a measurement value. This is why a single IFOV resolution cell or “spot size”, IS NOT the same thing as the Measurement Spot Size or Spot Size Ratio in the infrared camera! A discussion on Measurement Spot Size continues below.
Spatial Resolution
|
Specification name: |
Spatial Resolution, also called IFOV |
|
|
Definition: |
The angle which defines the size of the projected footprint area of a single pixel element through a particular lens FOV at a given distance. |
|
|
Expression: |
Number in milliradians “mRad” |
|
|
Example: |
1.2 mRad = 0.068 degrees |
Spatial resolution practical example:
Number in milliradians “mRad” 1.2 mRad = 0.068 degrees
Imagine a parking lot 50 feet away and 120 feet wide. Your imaging radiometer employs a 120 x 120 pixel sensor and its lens enables you to see the parking lot from one end to the other, all 120 feet. Also, picture a football on the ground in the middle of this parking lot. In this set up, each pixel would cover 1 foot of horizontal space and therefore the resolution foot print as determined by this IFOV angle/lens combination at this distance would be 1 foot.
The football, being roughly 1 foot in length, would register in only one pixel, or more likely is split between two pixels with each pixel returning the average radiance value for that footprint. The football’s size relative to the IFOV footprint at this distance is too small to be accurately resolved. You could not tell that it is a football even if the football was several degrees hotter/colder than the surrounding grass. The spatial resolution of this camera under these conditions is inadequate to measure the football’s temperature and you may not even notice the one or two pixels as being brighter or darker in the view screen. Certainly one pixel of information is insufficient to determine that there is a football present.
If I were to move closer, viewing only 30 feet of field width using the same camera, the resolution footprint would be 1/4 the size or 3 inches instead of 12 inches. There would now be 4 pixels sampling the football, but in a practical sense, still insufficient to see and measure the object. At a distance of 10 feet, the IFOV footprint is 1/12 of a foot or one inch yielding 12 pixels on the football which is enough to see that there is something there, measure it, and probably identify it as an oval shaped object. At this distance, detail features on the football such as the seams or laces are still much smaller than the 1″ resolution footprint and cannot be resolved.
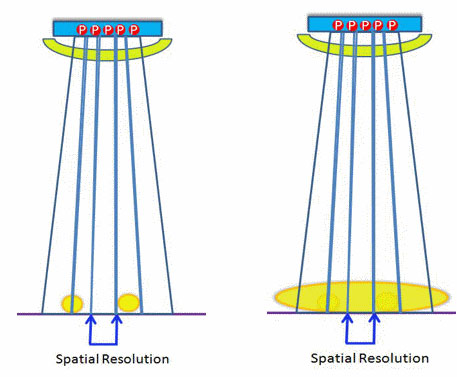
Consider the resolution cell footprint to be one single sampling point on an object. To clearly resolve and see detail on any object such as the laces on the football, multiple sampling points are required over each lace stitch. Therefore, IFOV footprint size needs to be significantly smaller than the smallest detail to be resolved, allowing for multiple samples on that detail element, or what is known as over sampling.
The term “over sampling” is not often used in optical discussions but is widely known as it relates to electrical terms and is stated as a ratio such as 10:1. To digitally sample a given waveform and to be able to reconstruct the waveform shape, typically requires a sampling rate at least 5x higher than the highest frequency component contained in the wave shape. Optically speaking, if one wants to see the laces on the football, the footprint size would need to be reduced to approximately 1/5 the size of the smallest feature on the object to be resolved. This would place 5 pixels over the smallest structure which is enough to give an accurate visual representation.
Measurement Spot Size
The one specification related to IFOV and Spatial resolution but perhaps of more practical importance to quantitative thermographers than the IFOV angle, and unfortunately continues to be missing from many imager data sheets, is “Measurement Spot Size“. Defined as the size of the area from which radiometric measurement data are derived, it is used to determine the minimum size of the measurement area where accurate measurements can be made for a given target / distance. As mentioned before, the measurement spot size is not a single IFOV footprint.
Measurement spot size is intrinsically dependent on the IFOV footprint size, but usually consists of several single IFOV footprint elements. Measurement Spot Size is not easily derived from IFOV because imager software algorithms typically rely on several pixels to derive the measurement value, even if ultimately only one pixel is used for the measurement. Without knowing how many pixels are used in the algorithm, or the effect of adjacent pixels on the one the data is taken from, it is impossible to use IFOV alone to calculate an accurate, real world spot size.
How many pixels (IFOV footprints) are needed for an accurate measurement and in what orientation is the manufacturer’s trade secret? Some manufacturers imply the measurement is made from a 3 x 3 array of pixels or 9 pixels total. Although this does not appear to be an absolute number, no other information is given. Some manufacturers have Field of View calculators on their websites; these will calculate the IFOV value for a given camera, lens and distance, but still give spot size as an IFOV value of a single footprint which then needs to be multiplied by some number of pixels. There is a term “MFOV” which stands for the “Measurement FOV”, also known as IFOVmeas, and it defines the resolution of the imager for measuring temperature. It is also expressed as an angle in mRad and because multiple IFOV elements are required to make a measurement, it is always larger than the IFOV value and is more representative of the actual spot size required for an accurate measurement.
There are a couple of ways to determine the measurement spot size. As previously stated, most manufacturers have a spot size measurement calculator which will allow you to approximate the measurement spot size. However, the best way to measure it is using your camera / lens combination with a procedure such as the one detailed in the standard for measuring distant / target size values for infrared imaging radiometers. This standard is available from Infraspection Institute.
Measurement Spot Size
|
Specification name: |
Measurement Spot Size, Spot Size Ratio (SSR) |
|
|
Definition: |
The size of the area from which radiometric measurement data are derived, used to determine the maximum size of the measurement area where accurate measurements can be made for a given target distance |
|
|
Expression: |
A ratio, or an array size in number of pixels (to be multiplied by the IFOV value) |
|
|
Example: |
50:1, 175:1, 523:1, or 3 x 3, 4 x 4 |
The below is an interesting excerpt from the FLIR FAQ page
Q: Does the spot meter use an average of pixels, and how many?
A: The spot meter uses the value from one pixel only, the center of the spot marker. It is not a calculated average of several pixels. This is the case both in the cameras and in analysis software like ThermaCam Reporter.
A: Due to optical dispersion, radiation from a very small area will not give one detector element enough energy for a correct value. We recommend making sure that the hot area where the spot value is requested is at least 3 x 3 (9) pixels. In many cameras and PC software programs, the spot marker has a shape to help estimate required size.
It is important to note that the above answer says that it should be used to “estimate” the spot size. Factors such as target orientation and shape will affect the actual measurement area. For instance, if the spot size is 3 x 3 pixels square, but the target has a round shape, what portion of the target will the measurement come from?
Dynamic Range
The final specification to be discussed is Dynamic Range. Simply put, dynamic range is the ratio between the largest and smallest possible values the device can output. In the case of an infrared imager, dynamic range is usually expressed in number of bits.
Another way to think of dynamic range is being defined as the range of the sensor being the largest possible signal it can detect divided by the smallest possible signal it can detect, or its noise floor. In digital acquisition systems such as an infrared imager, the dynamic range is also a function of the analog-to-digital conversion process which converts the analog signal from the detector, which is proportionally representative of the target radiance level, into a digital value.
Most cameras today are using detectors which are either 12 or 14 bits. This means the full scale range of the detector output will be divided into 4095 or 16,384 discrete levels. It’s interesting to note that a typical black and white display in the imager viewfinder may only be 8 bits or 256 discrete levels of grayscale (not to be confused with the display’s native resolution also expressed in bits) and while the imager captures its full-scale temperature range all the time, only a small portion of that is the region of interest we would like to look at. When the range level or span is adjusted on the imager, what we are doing is moving the display temperature limits into the area of radiometric interest. The camera is always capturing its full temperature range all the time but we are typically looking at only a small part of it.
Most electronics are not linear throughout their full-scale range. That is to say, at the very bottom of the range and at the very top of their range, they tend to be nonlinear yielding regions of greater inaccuracy. Because of this characteristic and to maintain operation within published specifications, manufacturers tend not to use the full dynamic range of the system. Instead, they use some portion less than full-scale, thereby operating the components within their linear region. In this case, when the specifications sheet says 12 or 14 bits it does not necessarily mean that all 14 bits are usable and viewable by the user. In fact, they typically are not. Generally speaking, more expensive systems with more bits typically can yield finer measurement resolutions and still remain linear throughout their range.
Dynamic Range
|
Specification name: |
Dynamic range |
|
|
Definition: |
A ratio between the largest and smallest possible values |
|
|
Expression: |
# of bits or # of levels |
|
|
Example: |
2 bits, 4095 levels |
Conclusion
In summary, it is important to know the specifications of an instrument as they relate to any given aspect of the instrument’s expected performance. When choosing an instrument for an application, clarify what the application requires in terms of measurement capability and ensure the instrument exceeds the requirement.
For example, guaranteeing a measurement of accuracy within 1% of true value cannot be done with an instrument with +/-1% accuracy.
-
Know what the specifications mean
-
Determine what the application requires
-
Stay within the limitations of the instrument
Happy Measuring!