Infrared Thermography Goes Underground: How a Major Metropolitan Subway is Using Thermal Imaging to Help Improve Reliability
 Mary Molle, Vice President
Jersey Infrared Consultants
PO Box 39Burlington NJ 08016Ph: 609-386-1281www.jerseyir.comAbstract
Moving more than 5 million people per day over almost 850 miles of track is a daily challenge for one of America’s largest metropolitan subway systems. Reliability and safety are top priorities for a transportation system that operates 24 hours a day, 365 days per year. Following an electrical incident that resulted in equipment failure and a fire, system engineers sought a means to rapidly inspect all of their electrical equipment, most of which was located in cramped, underground tunnels and restricted areas.
After weighing several options, it was determined that infrared thermography provided the greatest benefits. Thermal imaging could be performed without shutdowns; collected data could be documented to allow further investigation and repairs of problems, and serve as a baseline for future infrared inspections; and all electrical equipment could be inspected without walking or standing in the tunnels or on the tracks. The infrared survey was to inspect all electrical equipment including cables, connections and splices located in manholes or exposed locations within the tunnel and track areas. The goal was to identify potential problems that could lead to a future failure or fire.
The challenge of this project was overcoming numerous logistical hurdles of the transit and tunnel environment. The first hurdle was when to perform the infrared inspection. In order to obtain meaningful data, an infrared inspection should be performed at a time when there is significant load on the electrical system. Ideally, this would be rush hour; however, shutting down tracks or delaying trains during that time is not an option. After some experimentation, it was decided that the infrared survey of equipment located on the tracks would be performed beginning at the end of rush hour and be terminated three hours after that time or when electrical system load was no longer sufficient, whichever time came first.
Much of the equipment to be inspected was located in “manholes” or along walls of active subway tunnels. Walking between locations was prohibited due to the many miles of track to be inspected, and standing on or near the tracks with trains running was too dangerous. In order to safely access the subject equipment, it was decided to perform the survey from the front platform of a work train. Necessary safety equipment included harnesses to secure the thermographers to the work platform and radios to allow communication between the thermographers, train engineer, and transit maintenance engineers.
Although the survey was performed during “non-peak times”, the tracks were still in use and under the control of the track master. The work train was required to move at a speed set by the track master and could stop at a specific site for time periods ranging from 45 seconds to a maximum of two minutes.
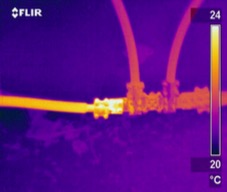
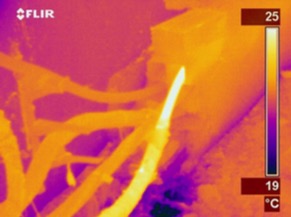
temperature(white) at a
cable termination
During a normal infrared survey, an infrared thermographer begins at point A, continues to B, C, D, etc., in a logical, time-efficient manner. As this survey began, it quickly became apparent that it was not possible to always proceed from one point to the next when working on active tracks. At all times, the speed and location of the work train was under the control of the track master. If the train engineer received instructions to “clear the track”, the work train immediately moved to the next sidetrack or onto another track. One of the biggest challenges on site was keeping an accurate record of what was inspected, and where the survey left off on each track. 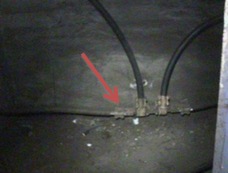 In order to cover as much as possible in the short time frames that were available, scanning was frequently performed on multiple tracks during the same work shift. Maintaining an accurate record was the job of a second thermographer.
A typical shift began 60 minutes before the anticipated start of the scanning window. After agreeing on the work plan for the shift, the thermographers and transit engineers would travel to meet the work train at the designated tunnel platform. Despite extensive planning and communication between the involved parties, some shifts began late due to delays caused by unforeseen circumstances.
As the work train approached a target area, the train engineer would bring the train to a crawl. The thermographer working with the imager on the front platform would begin scanning. Data that were to be collected at each location included the highest and lowest cable temperatures, and a thermogram and control photograph of any anomalies that were detected. In a conventional setting, a thermographer has unlimited time to obtain temperatures and adjust the thermal imager controls to record the best infrared image possible. This was not the case on this project. The work train did not stop – it would crawl through the subject area. In many cases, the train was ordered to speed up or clear the track before all data could be collected. In these situations, the location was noted in order that the train could return to the same spot as soon as possible to complete data collection. Again, accurate note taking and documentation by the thermography crew was the key to ensuring complete coverage.
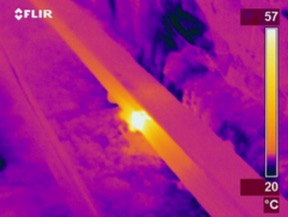
At the time this image was taken, there was a 41°C
temperature differential between rail sections
The survey included equipment located in thirty (30) tunnels. At the beginning of the survey, blueprints indicated 327 manholes and/or electrical cabinets to be inspected. As the survey progressed, previously unlabeled or “added” manholes were found along the inspection routes. When the thermographers encountered one of the new or previously unidentified locations, additional time was required at the site. The thermographer and the transit engineers needed to create a name for the new site that would fit into the transit system nomenclature and allow the area to be quickly located by anyone assigned to repair problems or conduct future infrared inspections.  Newly discovered areas were added to system blueprints for future reference.
During the infrared survey, 394 specific siteswere inspected. Each site was comprised of numerous cables, splices, connections and terminations. In addition to this equipment, the electrified third rail was monitored for the presence of thermal anomalies. A total of forty-one (41) thermal sections. anomalies or problems were located and documented.
Problems that were identified included loose connections at cable terminations; unbalanced loads, some with very high temperature differentials; damaged splices; and hot spots on the third rail.
In a subway system, a structure known as a third rail provides electric power to each subway car. Each car requires electricity for lights, heating and air conditioning, and power to its traction motors. A failure in the
third rail would result in an immediate disruption to electrical power for any cars on the track. In addition to any train on the track becoming stranded, all train schedules would be delayed until the track could be cleared and power restored. Due to the voltage involved and the size of the rails, the resulting damage of a third rail failure could be extensive and result in a long and costly outage.
Since it was not possible to do further investigation at the time
of the survey, it is possible that temperatures within
the box are higher than shown on the cable.
The amount of cable in a mass transit system is measured in millions of feet. Some of the possible problems in the cable system include frayed strands, failed splices, overloads or poor terminations. Since it is not practical to inspect all the cables by hand, one of the goals of the infrared survey was to identify cables that did need further investigation.
This inspection surveyed miles of cable located on and near the tracks. Thermal anomalies were detected that were indicative of each of the aforementioned problems. Since transit engineers were working with the thermographers during the survey, work orders were generated during the survey for  immediate investigation of the most serious problems. Proper planning and work being performed by experienced thermographers allowed the engineers to meet their challenge. All work was performed during off peak hours with no disruption to train schedules and no power outages. The final report included the detailed descriptions needed for follow-up and provided a basis for future studies. To assist with a baseline and to help with future studies, high and low cable temperatures were recorded at each manhole. Most importantly, the infrared survey identified forty-one (41) problems that, left unaddressed, could result in equipment failure or safety issues.
The entire project was completed and the final report was delivered in less than four weeks enabling system engineers to schedule repairs or corrective actions.

Advertisement
