Infrared Thermography Advances Aid Proactive Maintenance
R. James Seffrin
Jersey Infrared Consultants
P.O. Box 39, Burlington, NJ 08016
609-386-1281
Introduction
The use of infrared thermography for nondestructive inspections has grown considerably over the past 10 years. Traditional applications have included electrical and mechanical systems, building envelopes, and flat roofs. Since first becoming commercially available in the 1970’s, infrared thermography test results have saved billions of dollars by avoiding unscheduled downtime and detecting hidden failures in their early stages.
Until recently, the growth of infrared thermography as a predictive maintenance tool has been limited by the low resolution of thermal imagers and the lack of sophisticated software. New technology has overcome both of these problems and infrared thermography technology is poised to leap forward.
Infrared Theory
The theory of infrared thermography is simple. By utilizing a thermal imaging system, it is possible to detect and display the normally invisible infrared, or heat, radiation emitted by an object. This infrared energy is converted to a real-time visible light image, which is displayed on a monitor. Depending upon the type of thermal imager, object temperature measurement also is possible.
The introduction of the first thermal imagers provided the user a monochrome image of generally poor quality. Documentation usually was made with a Polaroid photo of the imager’s monitor. The quality of these thermograms was usually so poor that it also was customary to record the subject with a daylight photograph for clarification.
Early imagers were bulky, often weighing in excess of 30 pounds. Cryogenic gases or liquid nitrogen were required on many models. As thermal imagers became more sophisticated, features such as electric cooling and multicolor monitors began to appear; however, image quality still was mediocre to poor.
FPA Imagers
Thermography was forever changed approximately five years ago with the introduction of focal plane array, or FPA, imagers. Today’s FPA imagers provide image quality of up to 320 lines by 244 elements per line. This equates to 78,080 picture elements (pixels) per image. Each pixel is capable of providing a thermal image as well as a temperature. Because of the high resolution of FPA imagers, thermal images often are clear enough to obviate the need for corresponding daylight photographs.
|
|
|
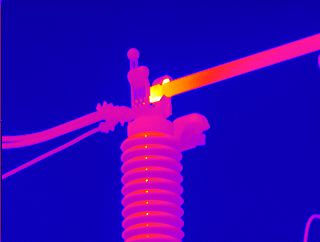
Figure 1. Thermogram shows overheated |
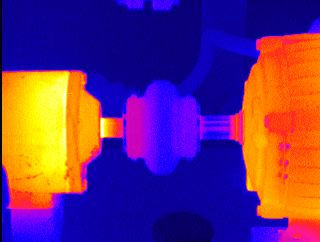
The high resolution of an FPA imager also enables the user to clearly resolve smaller temperature differentials and provide a more accurate diagnosis. With thermography, resolution means recognition. If you can’t see it, you can’t find it. If you don’t find it, you can’t fix it. The image at right illustrates the importance of resolution.
|
|
|
Figure 2. Thermogram shows temperature differential associated |
Image quality is not the only benefit provided by FPA imagers. Weight has been reduced to approximately seven pounds and many FPA imagers will fit in one hand. FPA imagers feature all-electric operation using either 120-volts AC or battery packs. By utilizing Stirling-cycle coolers, FPA imagers require no cryogenic fluids or gases.
Due to the increased resolution of the detector, temperature measurement also is more accurate than with older, traditional infrared scanners. On some models, spot measurement has been reduced to less than 0.4 inches at 30 feet with a standard lens.
FPA imagers also are easier to operate. Flir Systems Inc.’s Prism DS utilizes an internal 486 microprocessor for full-time, fully automatic operation. By automatically selecting temperature range, level, and gain, the Prism DS offers “point and shoot” operation. In the auto-image mode, the Prism DS automatically optimizes the displayed image in real-time, greatly reducing the chances for operator error.
Perhaps one of the greatest advantages of the new FPA imagers is the use of PCMCIA, or “flash cards”, for data storage.
Since flash cards can store images in a 12-bit format, thermal data is stored for the entire temperature range. This allows for greater flexibility when reviewing stored thermal images. When a 12-bit image is recalled, the user can change level and gain to further optimize the image or to work with temperature data that may not initially have been of interest.
Using the flash card, stored thermal data can be directly imported into a personal computer for analysis of thermal images and temperature. Because flash cards store data digitally, temperature accuracy is preserved when importing data into the software program.
Software
Until recently, software for thermography was limited. Often it was cumbersome and provided little post-processing capability. Some programs that claimed to provide temperature data often introduced large errors. Other software was capable of little more than printing thermal images with text to generate a hard-copy report.
Within the last year, thermal image analysis software has changed considerably. Full image manipulation now is available. Features include multiple color palettes, multiple isotherms, and the ability to change display temperature limits. Values for emittance, atmospheric attenuation, and background radiation also can be input into some programs, allowing for greater accuracy of observed temperatures.
Measurement choices also abound in some new software programs. Analyzir+ from FSI is a Windows-based program that offers multiple crosspoint temperatures, multiple line profiles, and multiple areas of interest. Temperature data can be viewed on-screen or exported to a spreadsheet.
Image subtraction allows for one image to be automatically subtracted from another reference image to provide a difference between the two. Trending allows several images to be automatically analyzed and temperature data to be graphed. This feature allows machinery or electromechanical components to be more easily and accurately studied over a period of time.
Predictive vs. Proactive
There has been some debate in industry whether thermography is predictive or preventive maintenance. Most predictive maintenance technologies rely on large, experience-based databases in order to compare observed data and formulate recommendations and failure predictions.
Because of the absence of such databases for thermography, some have argued that it is a proactive rather than predictive technology. In the case of electrical system inspections, thermography can provide early warning of incipient failures, but the amount of time before failure cannot be accurately calculated because of the exponential relationship of temperature and resistance.
Because it may never be possible to establish expert databases, thermography may always be limited in its ability to predict failures. The introduction of trending in the newer software does put thermography closer than it has ever been to becoming a predictive technology.
Thermographers
While the new FPA imagers have become more sophisticated, they also have become more user friendly; however, special training and knowledge of the system being inspected are critical. The Infraspection Institute in Shelburne, VT, offers training and certification of infrared thermographers.
The American Society of Nondestructive Testing has recently included thermal/infrared testing under its recommended practice SNT-TC-1A. Using the model provided by SNT-TC-1A, employers can customize NDT programs to meet their individual needs.
For those who choose to outsource infrared inspection services, there are several consulting firms worldwide offering a wide variety of services. A word of caution: services and capabilities can vary widely. Always look for an experienced firm that can provide solid references and has the latest thermal imaging equipment and software.
Advertisement


