Reliability Maintenance Augmented by Visual Plan 3D Visualization: Closing the Gap Between Inspection and Remediation
When it comes to mechanical, electrical and critical asset management, routine manual inspection is a critical component of every reliability maintenance strategy. However, identifying and reporting findings is only as effective as the remediation strategy. Inspection reports, maintenance histories, and design basis memorandums (DBM) stored in various data silos disassociate critical information from the physical location and environmental context of an asset: this leads to communication issues, service delays, extended downtime, and even catastrophic failure.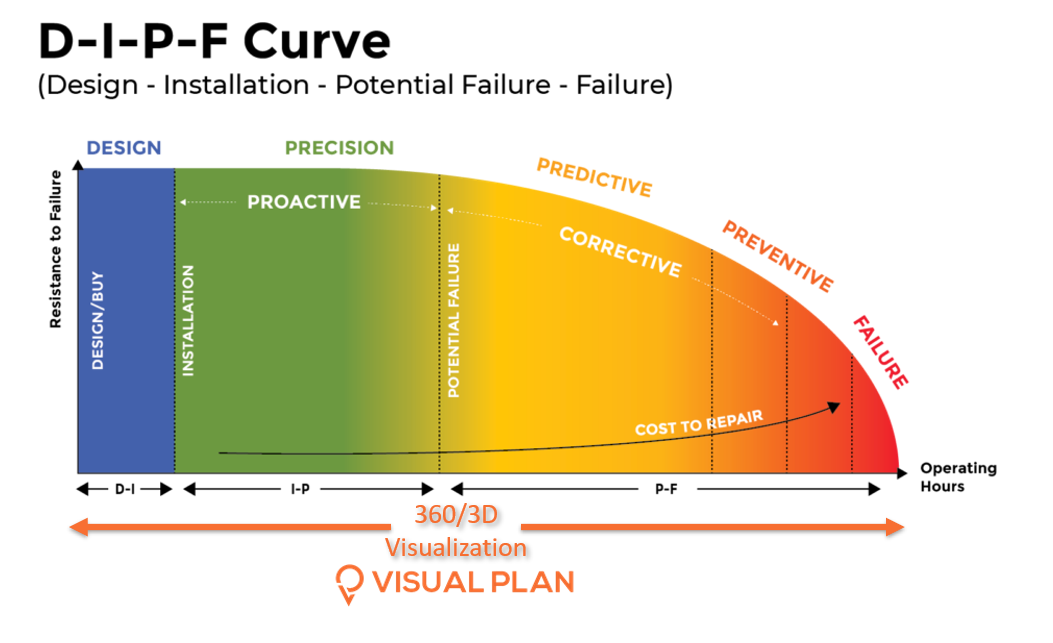 “A flagged and unread email with a PDF inspection report indicating critical asset issues with high risk to failure is no way to run your reliability program.”
Advances in analytics, AI, automation, and reality capture are improving efficiencies in reliability maintenance strategies by integrating predictive maintenance methodologies and documentation with streamlined visual data management to create actionable 3D visualization of the physical space and assets. No matter the inspection method, Visual Plan SiteView provides critical 3D visualization that narrows the time gap from issue detection to remediation.
How Can 3D Visualization Augment A Reliability Maintenance Strategy?
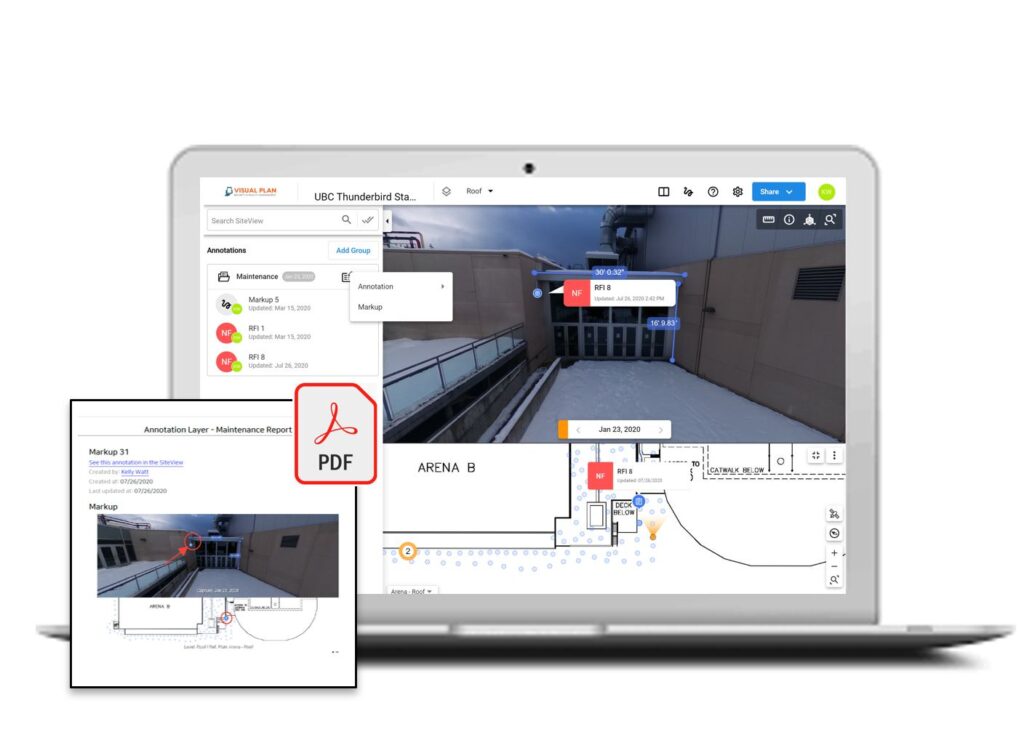
 Augmenting reliability maintenance programs with Visual Plan SiteView 3D visualization enables a different way of thinking. Rather than relying on traditional linear reports or tabular-based excel documents, users can access and consume consolidated report data from a single window and drill into asset or location-specific data to uncover pertinent information, compare drawings, overlay product models, access inspection findings, and review historical data.
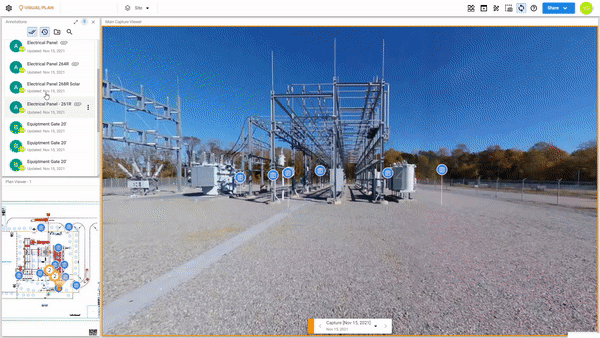
3D visualization and Digital Twins of municipal buildings, commercial real estate, factory, plant, or other job sites allow for remote access and a data-driven, navigable virtual tour of environment conditions. Navigating a site remotely via SiteView removes the hunting, speculation, and miscommunications that occur when communicating findings or trying to locate an asset on-site. This on-demand remote access through visualization supports more efficient pre-planning for timely remediation and safe navigation of dangerous sites. When SiteView is connected to work orders or integrity programs, operators and maintenance can respond efficiently and effectively with historical and current asset data in hand. The goal is always to fix the problem on the first site visit with as few challenges as possible: 3D visualization with SiteView makes it happen.
With 3D visualization driving the organization and contextualization of your reliability maintenance program:
- Data silos are reduced by connecting asset locations to information and systems.
- Root cause analysis can be performed by comparing all data available.
- Quick approvals and collaboration on best approaches done remotely.
- Managing operational change (MOC) and approvals are more efficient and complete through 3D visualization.
Integrating Non-Destructive Reliability Maintenance Testing With 3D Visualization
Regardless of your maintenance strategy, accurate asset information must be available to operations teams to effectively assess, prioritize and respond to identified issues. SiteView’s cloud-based 3D visualization tools powered by 360-degree photogrammetry reduce data silos, consolidate historical and current asset information, and incorporate inspection findings directly into a virtually walkable copy of the jobsite, to:
- Improve pre-planning for more efficient project scoping, equipment sourcing, route planning and asset location.
- Save time with enhanced visualization of asset location and historical data – no more “asset scavenger hunts” based solely on spreadsheets or lists of asset IDs
- Improve project certainty with better asset identification – no more overlooked or mis-identified assets
- Remove all doubt about site conditions and asset location before even going on site
Thermography
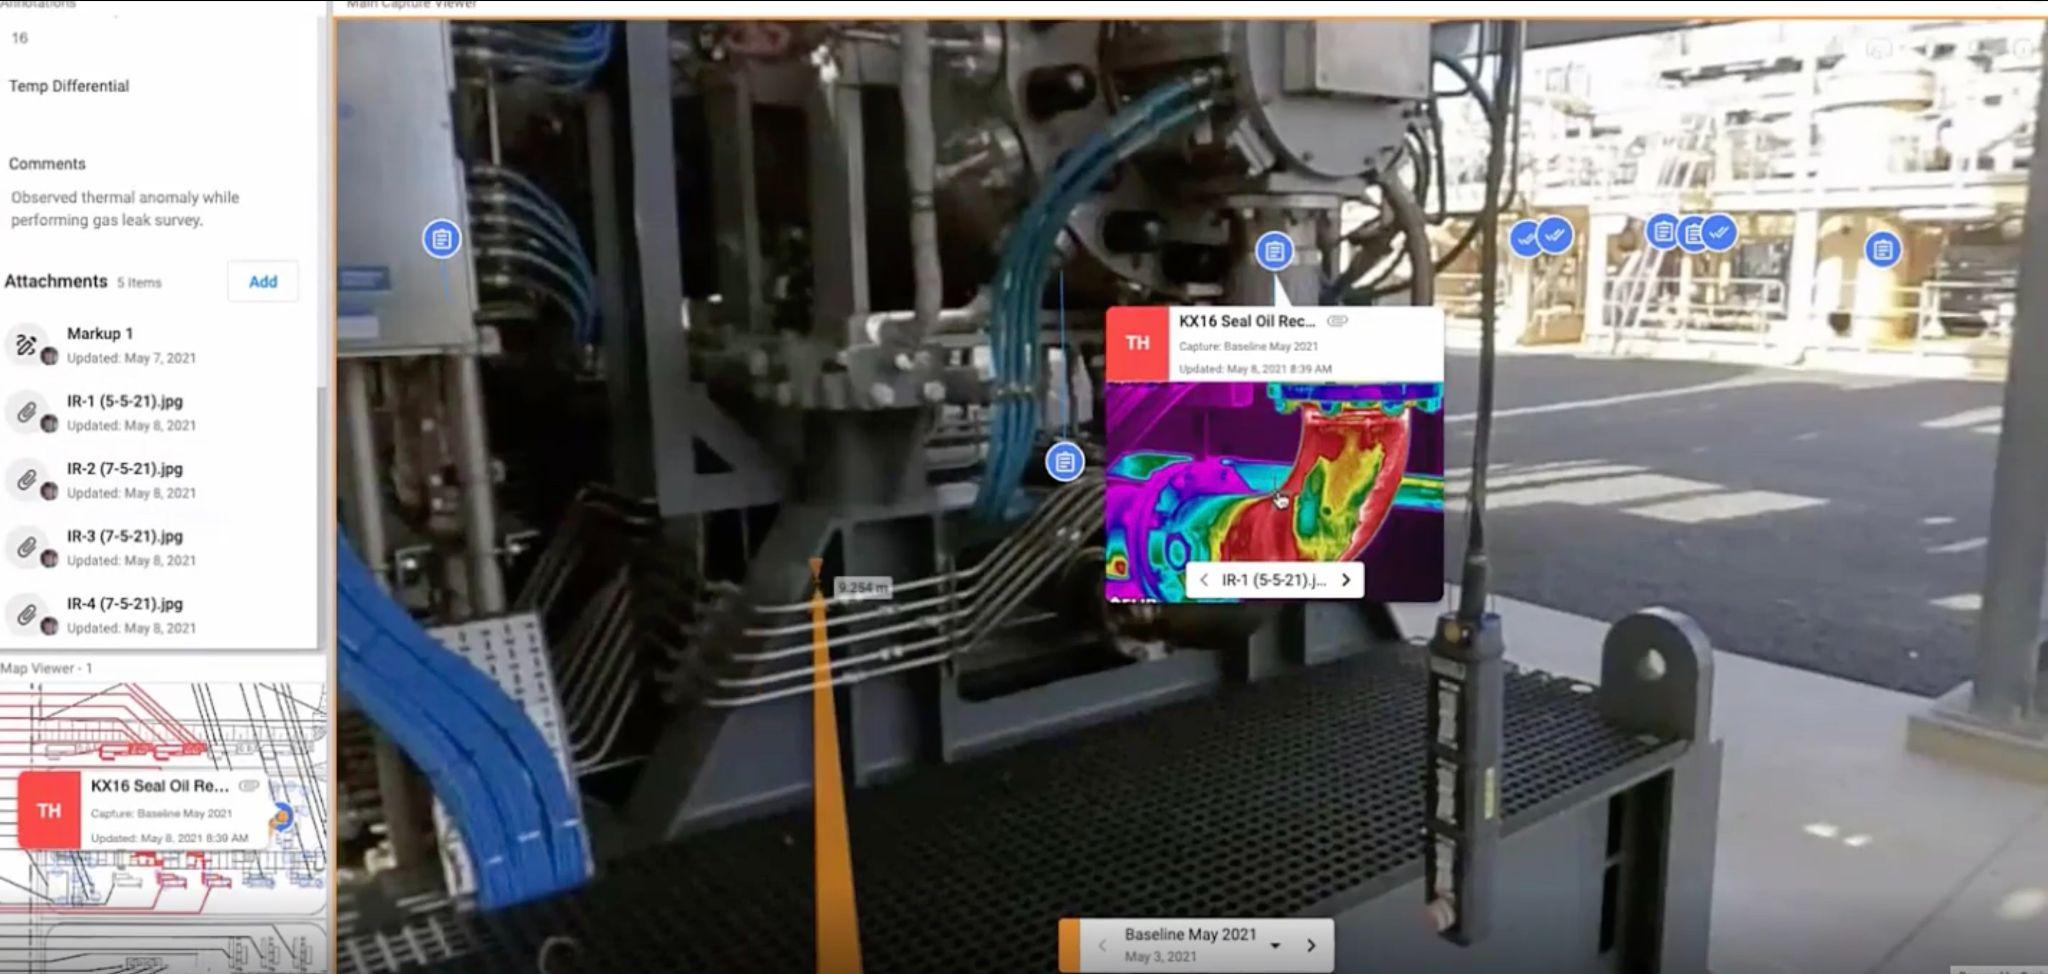 Thermal Imaging is frequently utilized as a method for protecting critical electrical and mechanical assets through both qualitative and quantitative temperature measurements. Findings reports can contain significant visual data including thermal imaging, asset photos, asset lists, and more.
With 3D visualization: Experienced thermographers apply tags to their testing process, however, 3D visualization offers even greater context and orientation for anomaly remediation.
Ultrasound
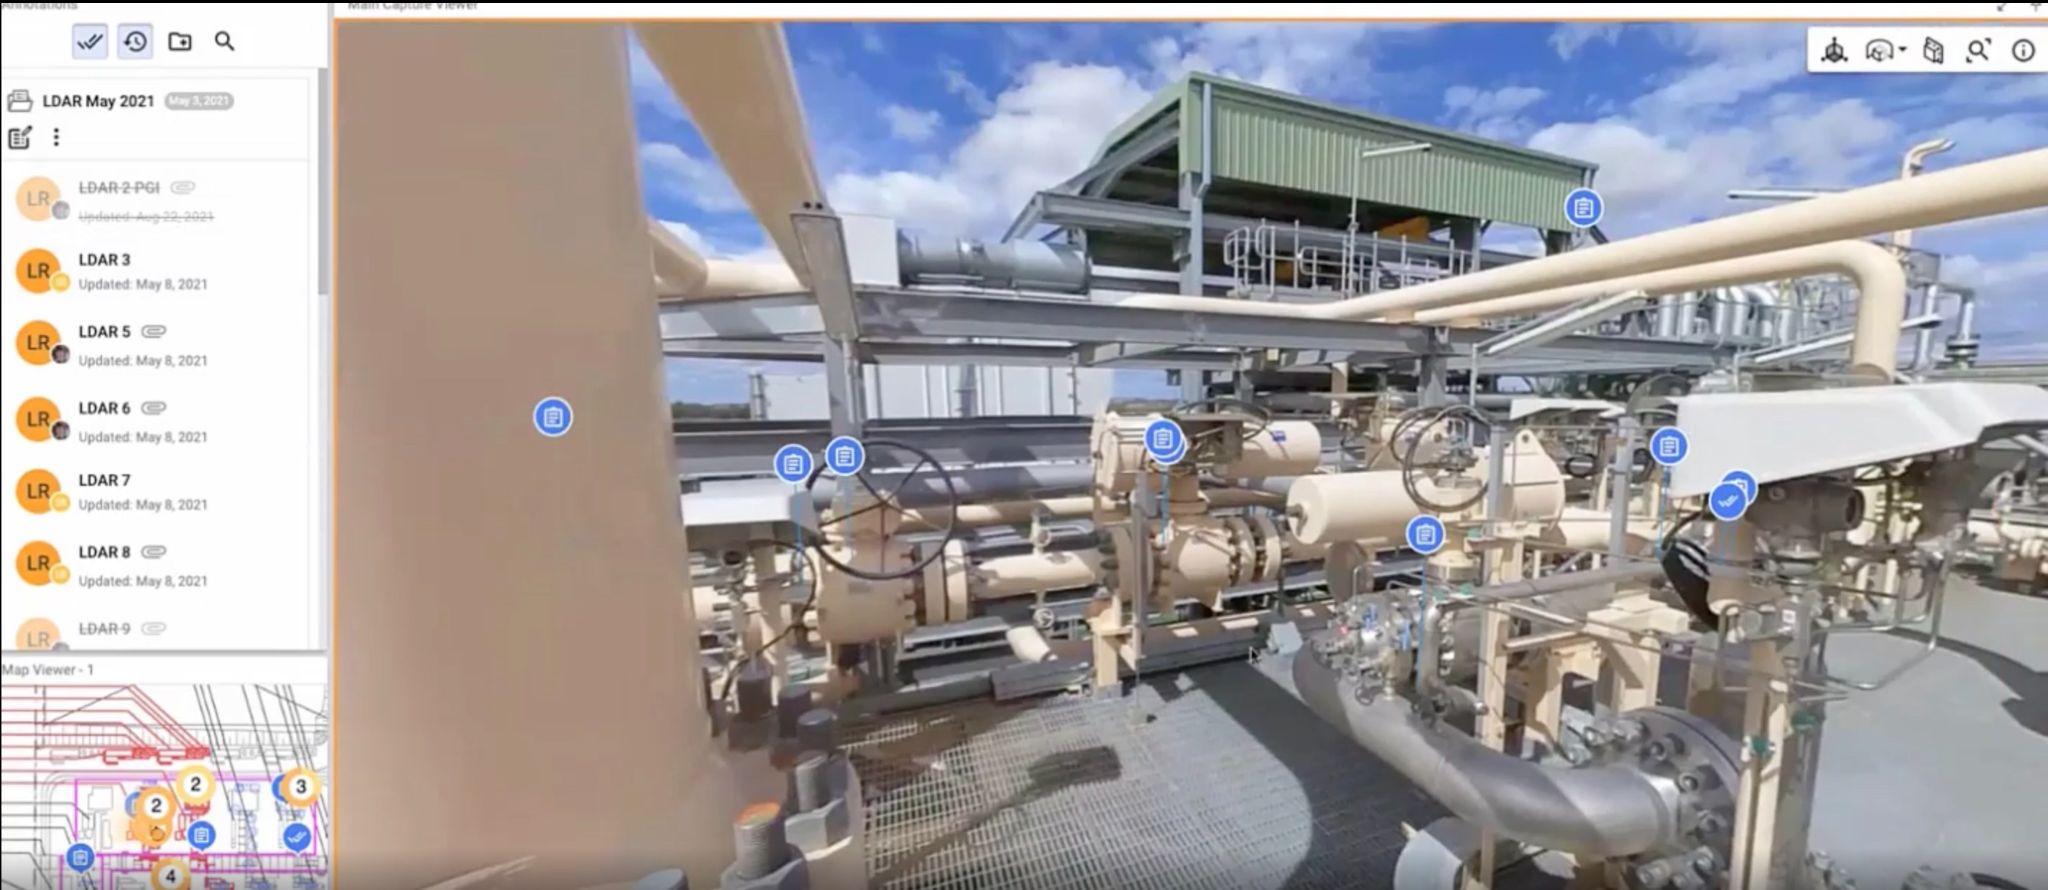 Ultrasound monitoring and inspections are critical for identifying issues for valves, controls, and steam traps, among other applications. For oil and gas processors, the findings of an ultrasound inspection can help identify and predict leaks in steam traps, which fail at an annual rate of 10-20%, representing 3% of all energy loss for major plants.
With 3D visualization: For large, complex sites, the time required for service providers to way-find, route-plan, and pre-plan necessary equipment is significantly reduced when 3D visualization is utilized as a scoping resource.
Vibration Inspection
Vibration meters are an ideal tool for identifying the root cause of imbalance, misalignment, bent shaft, soft foot, and looseness, and can provide evidence of inadequate lubrication or early-stage bearing failures in mechanical assets. Similar to ultrasound, the graphical outputs lack visual documentation of the physical asset and its specific location.
With 3D visualization: By tagging vibration inspection results directly to an asset in a Digital Twin, inspection findings gain greater meaning through environmental and historical data within the 3D visualization of site conditions.
Chemical Inspection
Many assets require multiple tests including visual inspection, mechanical, and/or chemical tests. Transformers are an excellent example where visual, electrical, and thermal inspections, as well as oil tests, are conducted. When these test results are stored in different integrity platforms, or PDF reports, the value of comparing the data is lost.
With 3D visualization: Feeding integrity inspection data into a single source with 3D visualization is a more efficient and dynamic solution to cataloging, managing, and accessing reports.
Graphical Reports
 Graphical readings are helpful with interpreting issues, but not helpful in locating and visually identifying the specific asset being inspected, the system sources, or the operational environment. With small and numerous assets, locating and matching them to report findings can be problematic; likewise, setting up repeatable inspection routes and training new staff can be time-consuming.
With 3D visualization: With Digital Twins, assets are geo-located within the virtual environment, and route planning and training can be performed virtually, enabling maintenance and operations teams to efficiently develop a common understanding of a site and its assets through 3D visualization.
Through 3D visualization, we can take inspection results from various sources and formats, and give them the spatial context and historical understanding required for effectively locating, repairing, and auditing them:
- Store and consolidate reporting histories within the asset’s environmental context to reduce data silos and streamline analysis
- Include singular snapshots of equipment performance at the time of inspection along with ongoing data collection from smart sensors, temperature-sensitive stickers, clamps, or other operational analytics.
- Decrease time between identifying a problem and resolving it by organizing and contextualizing anomaly findings.
- Streamline communication with third-party teams, service providers, maintenance crews, and stakeholders.
- Reduce further downtime and expense with more efficient communication toward remediation.
With Critical Assets, It’s One Thing To Identify A Problem – It’s Another To Locate It And Fix It.
Whether an inspection report identifies two findings or 100, the problem of locating the compromised assets within the site environment remains: traditional inspection reports are inherently limited in both spatial and historical contexts.
Without the context of where an asset’s location and its maintenance and repair history, the gap between identifying and remediating a problem expands as more time is spent searching for disorganized and siloed data, physically locating an asset, or inefficiently communicating with service providers.
The larger the time gap, the more it costs. For large operations, maintenance teams can suffer from data overload due to the sheer volume of reports: “With 800 different sites, my inspection test findings reports are all over the place – all of my tests are in different places, and don’t communicate anything about the site environment.” For an oil and gas tank inspection, an inefficiency like this due to a lack of consolidated visual and asset data can mean $37,000 per day, per tank, in additional downtime.
For more effective and efficient reliability operational maintenance to take place, we need to build resilience into the inspection-maintenance-repair process by augmenting reliability maintenance workflows with 3D visualization and Digital Twins. With Visual Plan SiteView’s virtually and remotely accessible 3D visualization of a site and its assets, we can break down data silos, streamline communication and reduce the gap from identification to remediation.
 Kelly Watt – CEO and Founder
Kelly Watt is a specialist with 3D lidar, photogrammetry, video imaging and analysis technologies. He is also a level 1 thermographer with experience in spectral imaging and reliability testing.
Advertisement
