Wayne Swirnow
President
Infrared Imaging Services, LLC
PO Box 221New City, NY 10956
Ph: 845-641-5482 www.infraredimagingservices.com

President
Infrared thermography is well suited for the detection of radiant heating elements and other sub surface heated piping. Defects in embedded conduits that carry heated fluids, gases or electrical heating lines can be difficult to pinpoint and often require costly and destructive exploratory digging. This excavation process is often ineffective, as there is no guarantee that the digging is occurring in the exact area of the defect. In retrofit construction, buried heating conduits in the work area must be located and marked prior to cutting or drilling into the substrate. This paper will discuss the use of thermography to locate radiant heating conduits and defects, and the effects of substrate type and thickness on the infrared process using an actual case study.
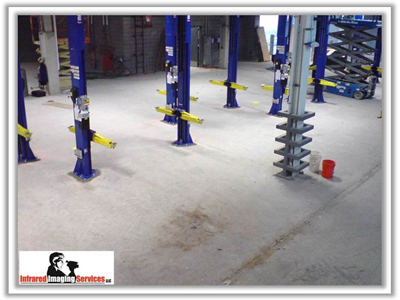
The case study for this paper involves a building with a radiant floor heating system consisting of approximately 50,000 linear feet of heating pipe beneath 5 inches of concrete. The requirement was to identify the locations of heating pipes in specific areas of the building and mark these locations prior to drilling holes into the concrete flooring for the mounting of equipment such as car lifts shown in Figure 1 and other automotive service equipment. Infrared Imaging Services LLC was contracted to perform thermography and locate the radiant heating elements prior to drilling.

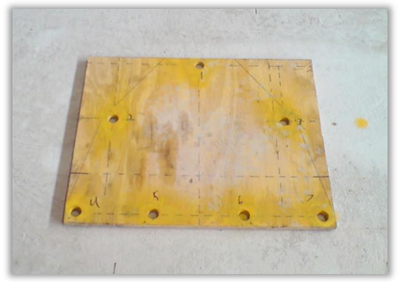
The customer supplied a template (Figure 2) showing the pattern of mounting holes for each of the two lift support columns shown in Figure 1.
In total, there were eight lifts to be installed with two columns per lift. Each column required seven mounting holes for a total of 14 holes per lift or 112 total holes to be drilled without hitting a heating pipe. The pattern of the holes could not be changed and the distance between with columns was fixed by the overhead bar which joined the two columns together. Should a single mounting hole need to be moved away from a heating pipe, the entire lift assembly would have to be moved. The overall layout of the lifts was tight, so there was limited flexibility on the order of an inch or so in adjusting the absolute position of each lift to avoid hitting any buried heating tubes. It was not possible to move a lift such that it would move over one complete set of pipes.
The typical set up for imaging subsurface radiant heating pipes is to start with a cold floor, turn on the heat, and image as the floor warms up. Imaging should be completed before the heat spreads out horizontally, creating a wider heat signature, thereby reducing definition between the heating lines. Increased horizontal heat spread makes it difficult to isolate the exact center location of each heating tube. Once the floor was at full temperature, it would not have been possible to identify the exact location of the center of each pipe.
Ambient temperature in the morning was approximate 45°F; the heat was off so the floor was at ambient temperature. A 5-inch thick concrete slab at 45°F possesses a lot of thermal mass and changing the temperature of this mass with radiant heating pipe at 115°F is a slow process. Once the heating system was initialized, it was several hours before first heat signatures began to show on the surface of the floor. Due to the thickness of the floor, the heat also dispersed horizontally as it conducted up vertically through the concrete to the surface. This resulted in the first visible heat signatures on the surface of the floor being relatively wide, with a poorly defined centroid region indicating location of the heating tube.
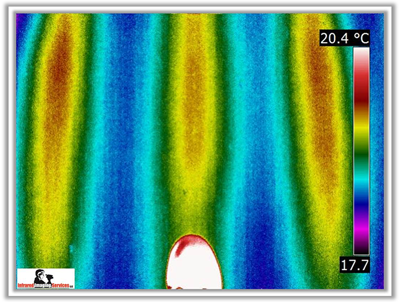
In Figure 3 the floor heat has been on for approximately 3 hours and is just becoming warm. Note how wide the initial signature is due to heat spread from the thicker floor. A size 11 work boot is shown for scale; total temperature span in Figure 3 is only 2.7oC.
Because this was a large garage, the contractor used 10 individual heating loops or zones to cover the target area. Each zone in the floor was an increasingly further distance away from the supply headers than the previous. Because of the length of each loop, and the increasing distances of each zone from the headers, the heat signatures within each loop and between loops developed at different times. The loop closest to the headers warmed up first and each loop at each increasing distance warmed up in its turn. Additionally, signatures at the beginning of each loop became visible first but then faded to zero moving down the length of the loop as the cold concrete extracted all the heat from the heating water in the pipe.
While imaging these floors as they warmed up, we saw that when the beginning (supply side) of a loop was nearing its full operational temperature, the ending area (return end) of the previous loop was still relatively cold. This created a situation where a strong thermal signature was within a few inches of a weak, marginally existent thermal signature and it created dynamic range issues for the imager. It became very difficult to resolve the cold pipe next to the hot pipe which caused the imager screen to saturate with the heat from the hot pipe while adjusting for the cooler pipe.
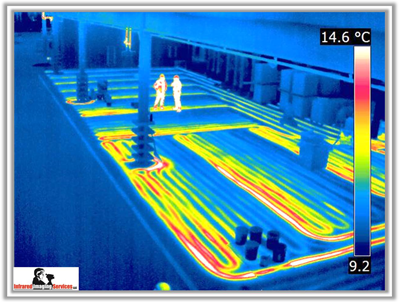
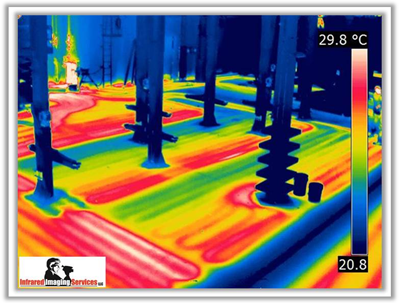
The image below (Figure 4) is an overview of the area. At the foreground you can see three loops running front to back with the supply side of each loop on the left and the return side to the right of each loop. Note that the supply end of each loop is warm and the heat signature slowly fades as it reaches the end of the loop when the heating fluid has given up all its energy to the cold concrete. From the middle of the image and to the top, there are 7 more loops running left to right. The loops at the top of the image are the ones furthest away from the supply header and there is very little heat in the beginning of the loop because the concrete on the way to that loop has extracted all the heat from the pipe.
At the top of the image are the heating loops farthest from the supply header. Along the right hand side of the image are the supply lines to those loops. Notice how the heat penetration down the length of the lines decreases with distance.
The usual practice for the thermographic inspection of subsurface radiant heating lines is to start the floor at ambient temperature, turn the heat on, and image as the heat signature first develops on the surface of the floor. At this point, the ideal situation would be a well-defined narrow heat signature. This allows for pinpoint location of the heating pipe. As the floor warms up and the floor materials begin to saturate with heat, the thermal signature spreads horizontally yielding a wider signature. This makes it more difficult to identify the exact center location of the pipe. In some cases, the signature from adjacent heating lines will begin to bleed together, resulting in a thermogram with very low thermal contrast between pipes and little at the pipe center.
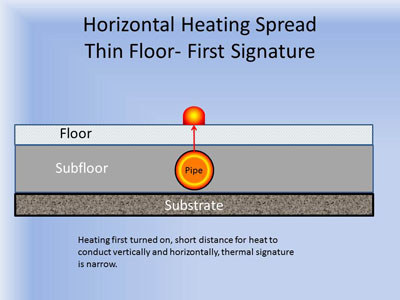
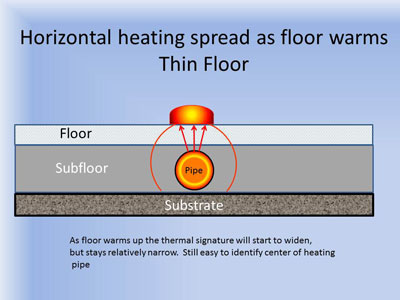
There are several factors affecting the spread of heat through the substrate material, two of which are its thickness and thermal conductivity. Figure 5 shows a cross-section of a thin substrate radiant heated floor. There is the substrate layer on which the floor is built. Often, there is a subfloor which the pipe may be laid on top of or embedded into and then there can be a finish flooring material which may be the same cement as a subfloor for industrial application or a tile or wood layer as is often used in residential applications.
This example (Figure 5) as the pipe warms up; heat conducts vertically to the surface of the finished floor and also conducts out radially from the pipe. Because the distance from the pipe to the surface is short, there is typically a very narrow, well-defined heat signature as the floor just begins to warm.
As time progresses, heat will continue to spread horizontally through the floor material and eventually cause a wider thermal signature on the surface as shown in Figure 6.
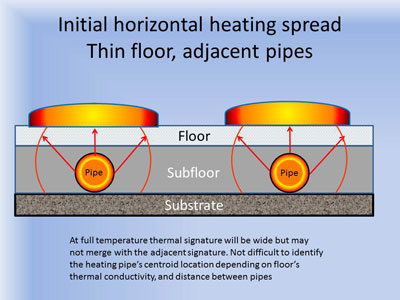
As the floor reaches full temperature, a thin substrate floor will have wider signatures, but often the signatures do not to bleed together, maintaining an area of high thermal contrast between the heating pipes as shown below in Figure 7.
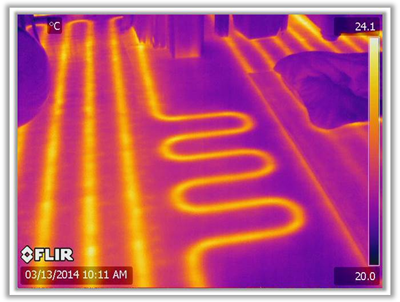
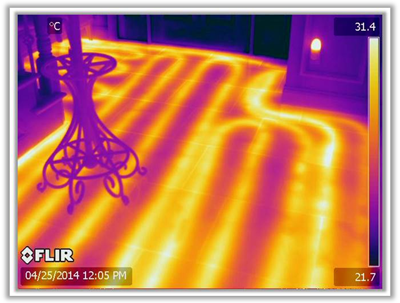
The two images below are thermograms taken of thin substrate residential floors. The top image, Figure 8, is a wood surfaced floor and the bottom image is ceramic tile. Although the heat has been on for several hours the wood floor, which is less conductive than the ceramic floor, still shows well-defined thermal signatures. In the ceramic floor (Figure 9) the heat signature has spread a little wider because of the increased thermal conductivity of ceramic tile, but shows a reasonably well-defined heat signature. Even for areas near the center of the Figure 9 thermogram where two heating lines are spaced close together, it is possible to make a very good estimation of where the pipe center is located.
In contrast to a thin floor, a thick subfloor behaves differently because of the increased distance from the heating pipe, which is usually located at the bottom of the material to the floor’s surface, Figure 10.
Because of the increased distance for the heat to conduct through, there is more opportunity for it to spread horizontally as it is conducting vertically to the surface. This results in an initial heat signature which may be significantly wider than what is seen on a thinner floor. As the floor warms up, signatures may bleed together (Figure 11) reducing the high contrast area between the pipes and making it more difficult to isolate individual heating lines and pinpoint the center locations.
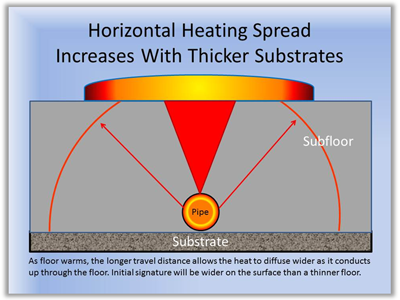
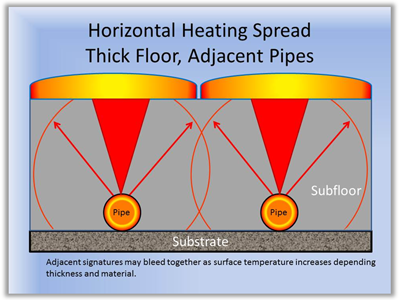
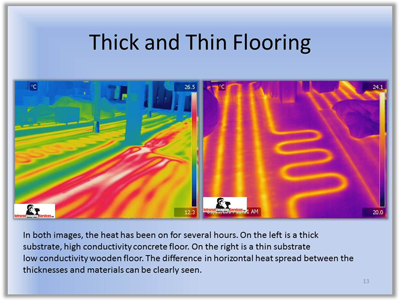
Figure 12 shows two thermograms. On the left is a thick substrate floor and on the right is a thin substrate floor. Note the difference in definition of the heat signatures between the two flooring types. In both cases, the heat has been on for several hours.
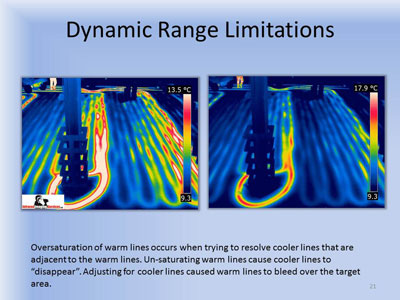
When imaging adjacent objects with significantly different temperatures where one is at the threshold of detection and the other is clearly visible, the imager may have difficulty resolving both objects at the same time. When adjusting the imager to clearly show the warmer heating loop without saturation, the cooler loop was not visible at all. Conversely, adjusting the imager to accurately pick up the cooler loop to identify the pipe center location caused the heat from the warmer loop to “bloom” and over saturate the imager’s viewing screen. In Figure 13, note how the warm supply side of the loop to the left of the center of the image bleeds into the cooler ending loop just to the right of it when adjusting the imager to resolve the cooler loop. In the right image when adjusting for the warmer loop, the cooler loop is not visible.
The car lifts were placed in a very tight configuration and the approximate location of each lift footing was marked on the floor. Figure 14 shows the wooden template used to simulate the footing of each column and Figure 15 shows a thermogram of the template on the floor. The floor was starting to get warm.
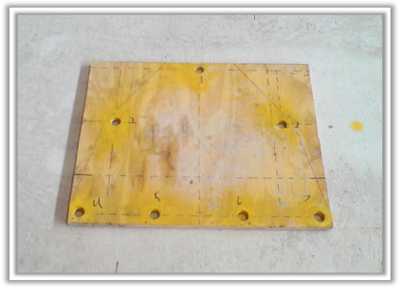
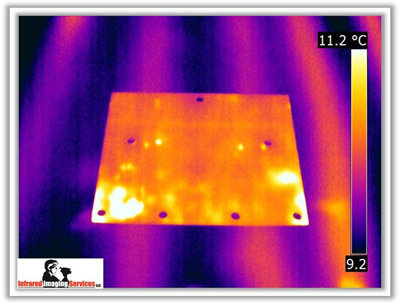
Looking at Figure 15, you will note how wide the signatures are even though the floor is just beginning to warm from ambient temperature after three hours. The horizontal spread of the heat signature as it travels up through the thick subfloor material makes it more difficult to isolate exactly where the center of the heat pipe is. Also noticeable is how close the mounting holes are to the heating signatures.
The ideal locations for the lifts were already marked on the floor upon our arrival and the requirement was to confirm that the alignment of each template cleared the heating pipes. We were allowed to make small adjustments on the order of an inch or so.
The two images below, Figures 16 and 17, show the qualified assistant holding down a piece of rebar which we then sprayed over with marking paint to leave a clean line on the floor located over the center of each heating pipe.
Notice in the left-hand side of the thermogram (red circle) that the warm area is the beginning of the loop and it is located directly next to the colder end of the adjacent loop. Adjusting the thermogram to effectively image both was impossible. Here, the settings are adjusted to best show the warmer beginning of the loop and the line we are working with. Tuning the imager for the cooler loop would have resulted in oversaturation of the warm loop and caused it to bleed across the imager view screen.
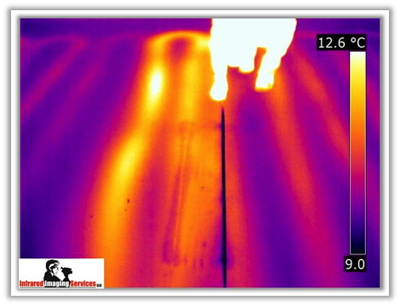
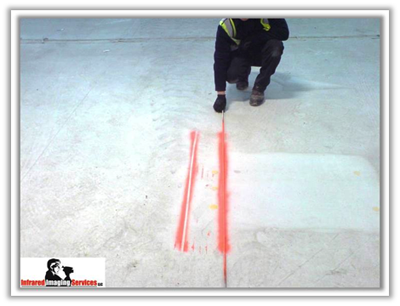
Figures 18 and 19 show an overview of the entire area with the multiple loops in the thermogram and the orange paint in a visible light image showing the areas where lift support columns are to be mounted.
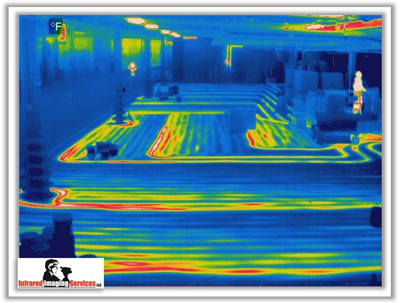
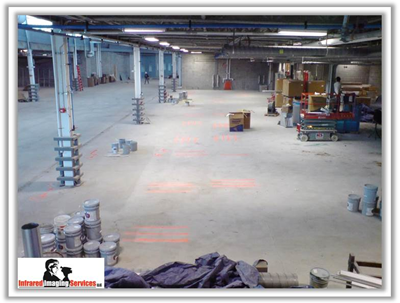
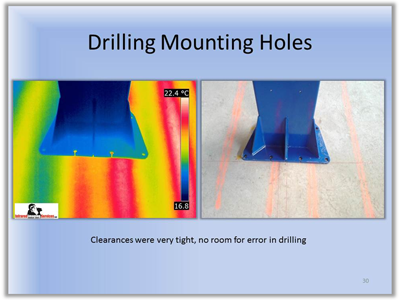
Figure 20 shows the thermogram and daylight image of the support columns and how closely the holes were aligned to the markings on the floor. The thermogram was taken on the second day when the floor had not cooled off sufficiently from the night before and the heat was again turned on in the morning prior to imaging. This resulted in even less thermal contrast between the heating lines than the previous day. When combined with the horizontal spread, it created a significant challenge in confirming the floor markings of the prior day. However, confidence was high on the prior day’s floor markings so they remained the primary guide for drilling.
The project was a success with all lift support columns mounted and drilled into the flooring without creating any leaks in the radiant heating pipes. Figures 21 and 22 give you an overview of what the lifts looked like once they were all mounted onto the floor.
There were several lessons we learned from this project:
Advertisement