See What You’ve Been Missing: How IR Windows Can Help Prevent Arc Flash and Assist with NFPA 70E Compliance
Martin Robinson, President
Tim Rohrer, Director of Sales IRISS, Inc.
6151 Lake Osprey DriveSarasota, FL 34240
Ph: 941-907-9128/Fax: 941-907-9129
www.iriss.com
Abstract
Nearly all arc flash incidents occur when someone is working live with switchgear covers removed. However, using infrared viewing panes as a part of your IR inspection program eliminates the risks associated with live thermography. When there are fewer risks, more inspections can be completed due to safer access, and this reduces the number of equipment failures because of routine monitoring under loaded conditions.
IR inspections are becoming so common that electrical switchgear manufacturers are fitting viewing panes, grills and mesh screens in an attempt to make their panels infrared friendly. NFPA 70E regulations restrict access to live components by defining a series of boundaries related to working with energized electrical equipment. Flash protection boundaries define the safe working distances in which any tradesman can operate. Thermographers must be fully conversant with these regulations, especially if they intend to remove covers for a live inspection. This paper will discuss in detail the material limitations and inspection methodologies associated with IR viewing ports, and the benefits of their use with regards to NFPA 70E compliance.
Introduction
An infrared camera requires a direct line-of-site to record an accurate image (direct temperature measurement), i.e. infrared cameras can only measure what they can see. Direct temperature measurements allow thermographers to precisely determine which components within an assembly are faulty, at what stage any faults found are, and what actions are required.
IR surveys are hampered by cabinet designs that do not allow direct temperature measurements of target components that require inspection. Also, thermographers are put at risk by having to open cabinets or doors in an attempt to gain access to the components that they wish to image. Even the most comprehensive risk assessments and method statements cannot avoid the obvious risks involved, especially arc flash.
What is an Arc Flash?
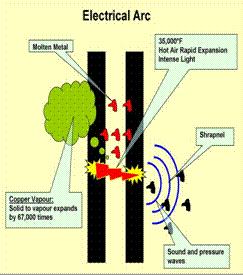
Think of an arc flash as a short circuit through the air. In an arc flash incident, an enormous amount of concentrated radiant energy explodes outwards from the electrical equipment, creating pressure waves, a high-intensity flash, and a superheated ball of gas that can severely burn a worker’s body and melt metal. The pressure waves can also send loose material like pieces of damaged equipment, tools and other objects flying through the air.
The vast majority of arc flash incidents occur when electrical equipment above 220 volts experiences a phase to phase or bolted fault. These occur due to:
• Accidental contact with energized parts
• Tools dropped on energized parts
• Tracking across insulation surfaces
• Wiring errors
• Contamination, such as dust on insulating surfaces
• Corrosion of equipment parts and contacts
• Improper work procedures
Arc Flash Test
Below are the images and results taken from a test completed by the National Fire Prevention Association. The images in Figure 2 show a test mannequin dressed in standard Type 1 PPE (flameproof pants and shirt) with a hard hat and safety glasses.
The mannequin was subjected to a controlled arc flash to the following test parameters: 22,600 A rms, 480 V, fault initiated on line lug of size 1 starter, feeder protected by a 640-A noncurrent-limiting overcurrent protective device and fault was cleared in 6 cycles.
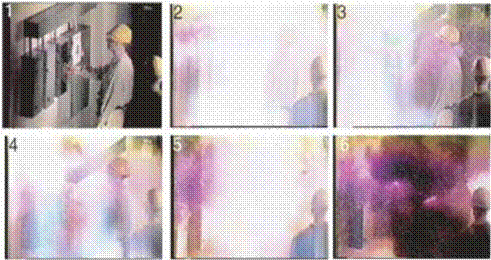
Figure 2: Stills taken from arc flash test using test mannequin
The resulting test subjected the test mannequin to the temperatures and pressures detailed in Figure 3 below.
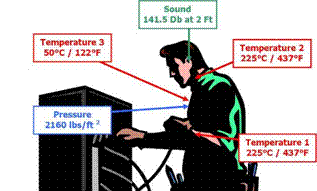
Damage to the body occurs at the following temperatures and pressures:
• A second-degree burn threshold or “curable burn threshold” is skin temperature raised to 175°F for 0.1 second
• A third degree-degree burn threshold or “incurable burn threshold” is skin temperature raised to 200°F for 0.1 second
• Eardrum damage > 720 lbs/ft2
• Lung damage >1728 lbs/ft2
This arc flash incident would have severely injured a worker. If this happened without appropriate levels of PPE, they would have received 3rd degree burns on exposed skin, as well as damage to hearing and lungs.
Five to ten arc flash explosions occur in electric equipment every day in the United States, according to statistics compiled by Capelli-Schellpfefer, Inc. The resulting injuries from which are so severe the victims require treatment from a special burn center. This number does not include cases in which the victim is sent to an ordinary hospital or clinic for medical treatment. Unreported cases and “near misses” are estimated to be many times this number.
Severe arc-flash burns can cause a slow, painful death, but even when they aren’t lethal, they can do serious damage. Hot gases can injure lungs and impair breathing. Even curable burns can result in painful skin and tissue injury that can take weeks or months to heal. However, not all arc-flash injuries are physical. Psychological effects like depression, job apprehension, and family tension can also manifest themselves. Therefore, avoiding any burn is important in terms of time, money, and a person’s well being.
Arc flash is a serious hazard that can be devastating to those exposed to it. It can also cause lengthy downtime to repair or replace severely damaged equipment. The requirements of NFPA 70E help plant and facility managers to reduce the probability of an arc flash event and its effects. This is where the use of thermography in conjunction with infrared windows can assist.
National Fire Prevention Association (NFPA)
The National Fire Protection Agency is the author of NFPA 70, also known as the National Electric Code (NEC). The NEC is an electrical design, installation and inspection standard and does not specifically address things like electrical maintenance and safe work practices. A national consensus was needed for safety while working around live electrical equipment. NFPA 70E is the standard for safe electrical work practices.
NFPA 70 suggests that a Hazard/Risk analysis must be conducted prior to working on electrical equipment. The core of the analysis is based on shock and arc flash boundaries which must be done by a qualified electrical engineer.
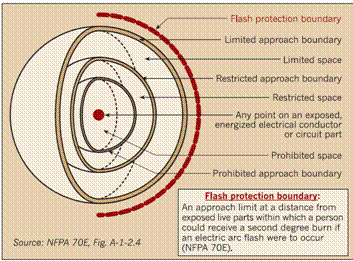
The NFPA 70E regulations define a series of boundaries related to electrical safety when working on energized equipment.
• Prohibited Approach Boundary
• Restricted Approach Boundary
• Limited Approach Boundary
• Flash Protection Boundary
Flash Protection Boundary
The flash protection boundary defines the safe working distances in which any tradesman can operate from an energized component. This distance represents the boundary between “just curable” (second-degree) and incurable (third-degree) burns on exposed skin. Thermographers must be fully conversant with these regulations, especially if they intend to remove covers to allow access for a live inspection to be completed.
It is necessary to perform a shock hazard analysis and a flash hazard analysis to help determine safe working practices and proper PPE. A shock hazard analysis will determine the voltage to which personnel are exposed, boundary requirements, and the proper PPE necessary to minimize the possibility of shock to personnel. The shock protection boundaries are listed in Table 1, below, and identified as limited, restricted, and prohibited for the distances associated with various voltages.

Table 1: Shock protection boundaries
Thermographers conducting inspections on certain switchgear may be classed as an unqualified person. As unqualified personnel, they will be notified and warned of hazards by qualified personnel when working at or near the limited approach boundary. When an unqualified person must work inside the restricted boundary, they will be further notified of the risks and hazards and continuously escorted by a qualified person. Under no circumstances will they be allowed inside the prohibited boundary.
The flash protection boundary for systems that are 600 volts or less shall be 4’ for clearing times of 6 cycles (0.1 second) and available bolted fault current of 50kA or any combination not exceeding 300kA cycles. For all other clearing times and bolted fault currents, the flash protection boundary will be determined based on the calculated incident energy of an arc fault, taking into account system voltage, available current, and clearing time, where incident energy is the measure of thermal energy at a specific distance from the fault.
Selection of PPE by task is allowed in lieu of a Flash Hazard study. However, for tasks not listed in Table 130.7(C) (9) (a) and for clearing times different than those listed, a complete Flash Hazard Analysis is required.
A selection from Table 130.7(C) (9) (a)
600 V Class Switchgear (with power circuit breakers or fused switches)
| Task |
Risk Level
(0 – 4) |
|
0
|
|
0
|
|
1
|
|
2*
|
|
0
|
|
2*
|
|
3
|
|
2
|
|
2*
|
|
3
|
|
2
|
NFPA 70E 2004 Personal Protective Equipment Requirements
Once a thermographer has identified the need to complete a live inspection within a flash protection boundary, they must then identify the level of Personal Protection Equipment (PPE) that is required.
Table 2 outlines the correct level of PPE that must be used in a live inspection of electrical switchgear based on the results from the arc flash study or the category outlined in Table 130.7(C) (9) (a). Thermographers must ensure that they are fully compliant with these regulations and the risks associated with live inspections of exposed energized parts.
Note: Above 600 V, removal of bolted covers (to expose bare, energized parts) carries a class 4 (scale 0-4 where 4 is determined the riskiest).
| Clas | Cal/Cm2 |
PPE
|
| 1 |
1.0 – 4.0
|
Cotton underwear, FR pants and LS shirt, hard hat, safety glasses |
| 2 |
4.01 – 8.0
|
Cotton underwear, FR pants and LS shirt, hard hat, safety glasses flash hood, leather gloves and shoes, hearing protection |
| 3 |
8.01 – 25.0
|
Cotton underwear, FR pants and LS shirt plus FR coverall, hard hat, arc rated flash hood, leather gloves and shoes, hearing protection |
| 4 |
25.01 – 40.0
|
Cotton underwear, FR pants and LS shirt plus multi-layer flash suit, hard hat, arc rated flash hood, leather gloves and shoes, hearing protection |
Table 2: PPE Requirements by Risk Category
Managing the Risk
The Hierarchy of Control outlines that any risk must be minimized to the lowest reasonably practicable level by taking the following measures in the following order and as determined by the risk assessment.
1. Elimination. The job is redesigned so as to remove the hazard. However, the alternative method should not lead to a less acceptable product or less effective process. If hazard elimination is not successful or practical, the next control measure is:
2. Substitution. Replacing the material or process with a less hazardous one. If hazard substitution is not successful or practical, the next control measure is:
3. Engineering controls. Installing or using additional machinery such as local exhaust ventilation to control the risk. Separating the hazard from operators by methods such as enclosing or guarding dangerous items of machinery. If this method is not effective, the next control measure is:
4. Administrative procedures or safe work practices. An example of this is to reduce the time the worker is exposed to the hazard. It could also include the provision of training and the performance of risk assessments. Only after all the previous measures have been tried and found to be ineffective in controlling the risks should Personal Protective Equipment be considered.
5. Personal Protective Equipment (PPE). This is the last control measure to be considered. If chosen, PPE should be selected and fitted to the person who uses it. Workers must be trained in the function and limitation of each item of PPE. PPE may be used as a temporary control measure until other alternatives are installed.
In most cases, a combination of engineering controls, administrative procedures and PPE are chosen to effectively control the risks. Where PPE is the main control method, it should be (where practical) used in conjunction with another method such as PPE and safe work practices.
Infrared windows meet the first requirement of the hierarchy of control as they eliminate the risks associated with conducting infrared inspections of energized switchgear by ensuring that thermographers are at no time exposed to live components during inspections of energized switchgear, motor junction boxes, etc.
What is an Infrared Window?
An infrared window is used to separate two environments of different pressure, temperature, etc., while allowing light at a specified wavelength to pass between the two.
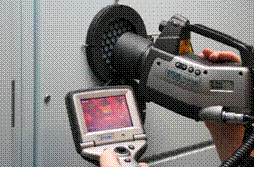
An IR window should, therefore, have the necessary characteristics for the IR equipment being used and
fulfill the strength, rigidity, and environmental requirements for the type of equipment in which it is fitted.
An IR window sounds more complicated than it really is. Although there are several types of windows available on the market today, there is nothing stopping the thermographer from designing a window for use in any particular inspection that they may wish to complete.
An IR viewing window is basically an optic material that allows IR energy to pass through it and a holder / body. Thermographers may even decide not to use an IR transmitive lens as the energized component that you are interested in is some distance from the cover and a protective grill can be used in place of the crystal. However, you must ensure that the grill is IP2X certified, that is, that the grill size must offer protection against foreign objects with diameters larger than 12mm. This method can significantly reduce the capital expenditure required and also has the additional benefit of allowing ultrasound inspections of the electrical switchgear as well as thermographic inspections. If, however, you decide to use grills, you must ensure that you comply with the PPE requirements outlined by NFPA 70E as you will be exposed to energized components.
The optics holder design depends upon a number of parameters. The field of view, equipment lens, and window size are all functions of the design and must meet all the parameters that the thermographer requires before a holder is manufactured. Also, a protective cover should be included in the design as crystals are very expensive and in some cases extremely fragile.
Alternatives to IR Windows
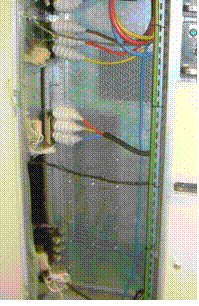
There will be times when we will not be able to implement the use of IR windows and therefore need to
look at other methods to facilitate a direct temperature measurement.
Screens and modified panel designs
Some panel manufacturers have thought of this and modify covers to allow inspection of internal components. The covers are modified by either having a series of holes drilled or punched into the cover or by inserting IR transmitive screens into the cover directly (samples can be seen in Figures 6 and 7). This type of modification allows thermographers to see multiple connections and components inside the panel that may be close to the actual cover, such as distribution boards, isolators, etc., and take direct temperature measurements.
Issues to be aware of are that even though you may be imaging through a grill, there will be transmission losses. These can sometimes be as much as 60%. You must ensure that you know the transmission of the grill and mark it on the panel for other thermographers to reference.

Figure 7. Images of modified panels using alternative types of infrared windows
Characteristics of Materials
Table 3, below, shows the most commonly used materials for infrared windows. It can be seen that the materials vary considerably in material properties and points to other areas that have to be considered such the environment in which the windows will be operating and the operational requirements. We will discuss each of these in turn.
| Material | Chemical Symbol |
Wavelength
µm |
Knoop Hardness |
Soluble in H2O |
| Calcium Fluoride | CaF2 | 0.13 – 10 | 158 | YES |
| Sapphire | Al2O3 | 0.15 – 5.5 | 2000 | NO |
| IR Polymer | N/A | 0.15 – 22 | N/A | NO |
| Germanium | Ge | 1.8 – 23 | 780 | NO |
| Zinc Selenide | ZnSe | 0.5 – 22 | 120 | NO |
| Barium Fluoride | BaF2 | 0.15 – 12.5 | 82 | YES |
Table 3: IR material properties comparison table
Environmental Considerations
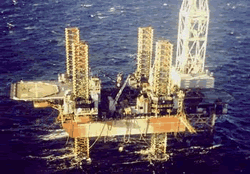 Infrared windows are used all over the globe. Careful consideration must be given to the environments in which the windows will be used, i.e. is the window for indoor or outdoor use? Will it be submitted to severe environmental conditions such as:
• UV exposure
• Humidity
• Rain
• Snow
• Sea water
• Acids or alkalis
• Extreme temperatures
• Etc.
Certain materials are more prone to the effects of the environment than others. Choosing the wrong material will give rise to premature failure and careful consideration must be given to the type of lens material that is chosen, i.e. do not use a material that is soluble in water in a humid environment.
Operational Considerations
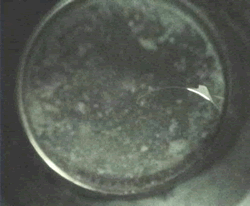
Some materials are less robust than others. The Knoop hardness number indicates the resistance to local penetration. Rugged materials such as Sapphire (Al2O3) have a high number; fragile materials like Barium Fluoride have a low number. Also, there is evidence that high frequency noise and vibration levels will degrade the transmission level of certain crystals and are therefore not suitable for use in industrial environments. As with environmental issues, operators must give serious consideration to the operating environments in which they intend to use IR windows. Choosing the wrong material would be a very costly exercise!!
Note
The two most common failures of infrared windows are breakage and water damage / ingress. Manufacturers place too much importance on providing IR window materials with a very high infrared transmittance value; more consideration must be given to the environmental and operational conditions in which the window will be used.
An IR window must be functional for the life of the panel in which it is fitted; therefore, never trade off mechanical properties for higher infrared transmission rates. You don’t need them. You do, however, want an infrared window that lasts.
Figure 3 shows an image of an infrared window crystal lens that failed after 2 years in an air conditioned environment. This IR window now has zero infrared or visual transmission.
Material Transmission Rates
The ideal IR window is one that would allow all the infrared radiation to pass through it with zero losses. Unfortunately, with the materials available presently we cannot achieve the perfect transmission rate of 100%, but we can get very close, i.e. coated Zinc Selenide has a peak IR transmission rate of 99%.
Kirchhoff’s Law states “the sum of the radiation leaving the surface of an object = 1”
Therefore, we have to try to keep emittance and reflectance values as low as possible to achieve as high a transmittance value as possible. This is achieved in a number of ways such as coating materials with an anti-reflectance coating to reduce reflectance and choosing the correct material for the IR wavelength suitable for your camera. However, a high transmission rate is not the most important property of an infrared window. In fact, there are many other issues that can have a very detrimental effect on the results gathered through infrared windows.
Kirchhoff’s Law
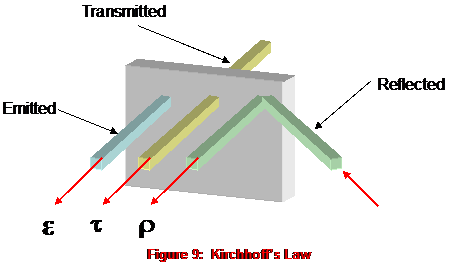
Chart 1 demonstrates the transmission rates of the chosen materials and where they fall into the LW and SW infrared wavelengths. It can be seen that it is imperative that full consideration is given to the type of equipment being used as some materials will be unsuitable for use with a LW camera as is the case for Sapphire (Al2O3), and SW cameras such as Germanium (Ge).
Some materials are, however, suitable for use with both LW and SW cameras, i.e. coated Zinc Selenide (ZnSe). Although these materials tend to be more expensive for that reason, consideration must be given to the budget available as well as the technical and physical requirements of the required IR window.
Note
When deciding on the transmission rates of IR materials, ensure that the supplier quotes against a known wavelength. Our research has shown that in the PdM field, the majority of LW thermography is at approx. 9 µm and SW is at approx. 4 µm. Thus, as a benchmark, you should ask for IR transmission at these wavelengths.
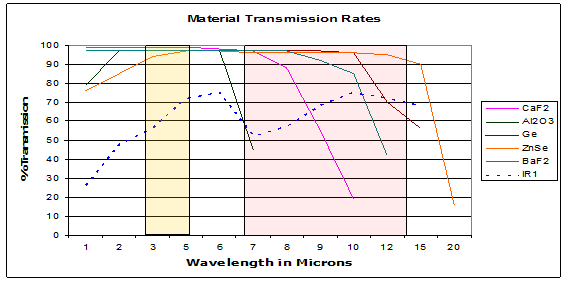
Chart 1. IR Material Transmission comparison chart
The most important thing to remember regarding IR transmission rates is that you must know the transmission rate and wavelength that your IR window is operating in. It is irrelevant to the measurement whether it is 99% or 50%, as the camera / software will calculate the temperature based on the transmission rate that you put into the calculation. Therefore, you must be confident that the transmission rate is correct.
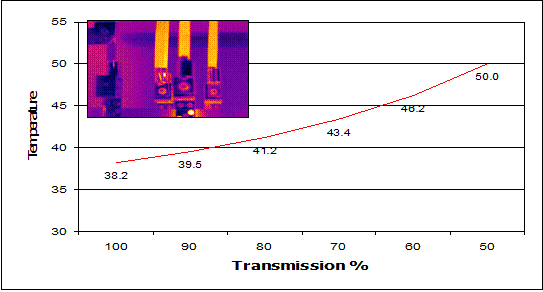
Chart 2: Transmission vs. Temperature Chart
The Transmission vs. Temperature chart, above, shows how calculated temperature readings change when you vary the transmission rates. The transmission rates were changed from 99% to 50% using the same image. This gave a difference of 11.8 °C.
Other than the temperature difference, the most significant thing to note, is that the calculated temperature increases when the transmission rate decreases. Therefore, if your transmission rate is too high, the calculated temperature is too low! This will cause problems, especially if you are using temperature difference as the means of categorizing faults or scheduling maintenance.
Emissivity or Emittance
The emissivity of an object is the ratio of radiant energy emitted by that object divided by the radiant energy which a blackbody would emit at that same temperature. If the emittance is the same at all wavelengths, the object is called a graybody. Some industrial materials change their emissivity with temperature and sometimes with other variables also. Emissivity always equals absorption and it also equals 1 minus the sum of reflectance and transmittance (E = A = 1 – T – R).
Electrical cabinets, etc. are full of different materials of varying emissivity. They can range from 0.95 to 0.15 and, as stated, these values can change with age and temperature. The graph below shows, as with transmission, how calculated temperatures can be adversely affected if you get them wrong and, as with transmission, if your emissivity is too high the temperature is too low! Therefore, it is imperative that the thermographer knows the emissivity of the target components within the panel. Another method used by thermographers is to cover or coat all targets with a material of a known emissivity, i.e. electrical tape, bar-b-q paint, etc.
The graph below shows how calculated temperature readings change when you vary the emissivity rates. The emissivity rates were changed from 99% to 50% using the same image. This gave a difference of 12.2 °C.
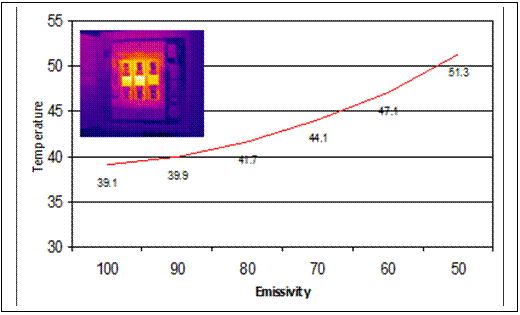
Chart 3: Emissivity vs. Temperature Chart
Note
The worst case scenario would be to get the emissivity and the transmission totally wrong. In the example shown above in Chart 3, the temperature with emissivity and transmission set to 0.95 is 39.1 °C. If you now change both the emissivity and transmission settings to 0.50, the calculated temperature now changes to 73.6 °C an increase of 34.5 °C, almost twice the original apparent temperature. Again, just as with transmission, this will cause real problems if you are using temperature as the means of categorizing repairs or scheduling maintenance.

Figure 10: The above images are of de-energized switchgear during build phase; all components are at the same temperature. The apparent temperature differences are due to material emissivity and reflection.
Infrared Viewing Windows: Where Do I Start
The most common questions asked regarding IR windows are:
• How do I work out where to put the windows
• How many infrared windows do I need
• What can I see through an infrared window
• How do I use infrared windows
This section of the paper will deal with each of these issues individually.
How do I work out where to put the Viewing Windows?
The first thing that you need to do is identify the targets that you want to look at during your infrared survey. Traditional surveys commonly only look at the bolted connections within the switchgear as these are considered as being the “weakest points” or the “points most likely to fail”. These may include:
• Cable connections
• Bus bar connections
• Isolator or circuit breaker connections
• Etc.
It should be noted that Infrared Viewing Windows are also installed to allow thermographers to monitor many other things, from R & D on critical component temperatures within an assembly to load characteristics / phase imbalances across breakers. However, for the purposes of this paper we will be concentrating on bolted connections on a generic piece of switchgear.
Stage 1:
Safety First. You will need to isolate your switchgear to allow safe access to the internal components. This inspection will allow you to identify what you wish to inspect inside of the panel and allow you to take all relevant measurements required to complete the calculations required to find the FOV.
Below is an illustration which demonstrates inspection points that you may consider when installing IR Viewing Windows. Another important point is that you may need to install IR Viewing Windows in the front and rear of the switchgear (rear Viewing Windows typically allow access to the main breaker connections, bus bar connections, etc.).
Note
At this point, you should make every effort to standardize the target emissivity through the use of paint, electrical tape or high emissivity target labels (who knows when you will be able to power down again). Also, take as many digital pictures as possible; these can be used for your report templates and for future reference. In fact, some companies even place laminated copies of these pictures by IR windows.
If you cannot power down for this inspection, speak with the switchgear manufacturer regarding your particular range of switchgear. They are normally very keen to help and may have drawings, pictures, etc. that they can let you have copies of to allow you to calculate the number of Viewing Windows that you require. You will also be able to rely on your own knowledge or your maintenance engineer’s knowledge of your switchgear to help you decide where you want to place the IR Viewing Windows, especially on established distribution systems.
Stage 2:
Once you have decided on what you want to see through your IR Viewing Windows, the next thing that you will need to do is decide what size of IR Viewing Window you require and where you need to install it to ensure maximum coverage and therefore maximum efficiency. The formula for calculating the field of view (FOV) through an IR Viewing Window is:
2 x the tangent of 1/2 the angle x distance
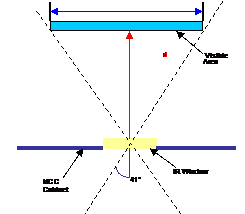
Typically, infrared cameras have a standard FOV of approx. 24 degrees, in the horizontal, and 20 degrees in the vertical. It is advisable to only complete your calculations to the standard lens FOV even if you have wide angle lenses.
Another important consideration is if you can manipulate the camera when looking through an IR Viewing Window. This has the effect of increasing what you can see by up to a factor of 3, which means that if your target is 12 inches across you can reduce this to 4 inches (for IR Viewing Window size calculation purposes) to allow for the additional area you will see when you manipulate the camera from left to right or up and down.
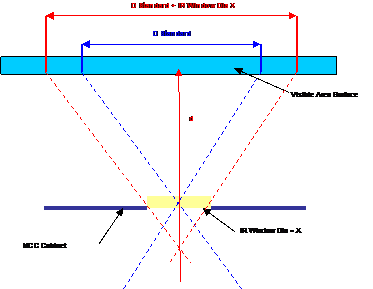
A very important point to note when you calculate an FOV is that the distance from the cover to the target (D) comes back to a single point (see Fig. 3) and does not take into account the size of the Viewing Window, camera detector array, etc. This means that if you calculate an FOV of 2.8 inches, using an IR Viewing Window of 2 inches would give you a target (D) of approx. 4.8 inches; moreover, a 4 inch IR Viewing Window would give you a target (D) of approx. 6.8 inches.
This emphasizes why it is important to understand the functions of your camera lens FOV, number of required IR targets, cabinet depths, etc. A rule of thumb is that the closer the target component is to the cabinet cover, the larger the IR Viewing Window required.
Tip
Some thermographers find it easier to let the camera show them what it can see rather than completing a number of calculations. The following procedure is a quick method of working out what you can see at set distances with your own equipment, lenses, etc….
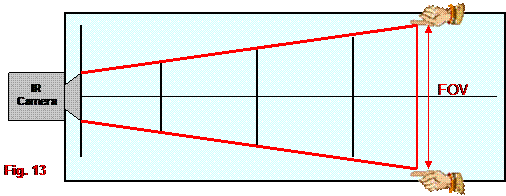
1. Place a piece of paper on a flat, even surface and mark out a line with increments of 2 inches up to approx. 24 inches.
2. Place the camera lens at the 0 datum line.
3. Using a heat source (finger, warm coffee cup, etc.), move the object in from the LH side outside the visual frame until it can be seen and mark the paper, repeat the same procedure for the RH side and mark the paper. (see Fig. 13).
4. Measure the distance between the 2 points. This will give you what you can see using the camera and lens at a set distance.
a. Note: Once you have worked out the FOV distance that you can see you will need to add on a factor to take into account the IR Viewing Window that you intend to use. This is done by subtracting the camera lens diameter from the FOV and adding the IR Viewing Window diameter that you intend to use.
Example
FOV of a 24 degree lens at 16 inches as measured using the above process = 8 inches. The camera lens = 1.75 inches, thus the FOV of the camera = 6.25 inches.
• Using a 2 inch IR Viewing Window would give an approx. FOV of 8.25 inches
• Using a 3 inch IR Viewing Window would give an approx. FOV of 9.25 inches
• Using a 4 inch IR Viewing Window would give an approx. FOV of 10.25 inches
5. Most thermographers measure a point at 18 inches and then join the points together at the increments marked on the paper and then keep a chart with their camera for easy reference.
6. At this point, you should complete the exercise using any other lens assemblies that you may have, and you should also use this exercise to work out the minimum focus distance of your camera by moving the target as close to the lens as possible until it is out of focus.
Note
Although the above technique is not 100% accurate it gives an extremely good result. Try it for yourself; it is a simple technique that really works well!!
Once you have identified what you want to see, calculated the FOV of your camera, and identified the IR Viewing Window size that you need, it is time to fit them. Be aware of internal obstacles such as cables, internal covers, Perspex / Plexiglas, etc. These may need to be removed or modified to allow you access to your targets. This is extremely important when putting IR Viewing Windows into brand new switchgear prior to installation into a building. Make sure that the contractors installing the cables do not route the cables in front of your IR Viewing Windows as this will render them useless.
How Many Infrared Viewing Windows do I need?
As discussed, once you have identified your required component identification and FOV calculations, you will be able to identify fairly accurately the number of IR Viewing Windows that you require. However, do not fall into the habit of installing the largest Viewing Window that you can; take the time to calculate as best you can the best Viewing Window for the job at hand.
Remember, the larger the Viewing Window the greater the cost!! If you are working on a limited budget you may end up running out of funding before installing all the IR Viewing Windows you require to cover everything that you want on your IR inspection route.
What Can I see through an Infrared Viewing Window?
An Infrared Viewing Window allows you to inspect the inside of an electrical cabinet to check the physical condition of the components that you have chosen to inspect. As with traditional thermographic inspections, we can see temperature differences very clearly. However, when trying to survey components that do not have any faults, very little load, and are at the same temperature, you will see very little if anything at all. A common complaint is that the infrared window is “not working” because the thermographer cannot see anything through it. The images in Figure 14 show images taken through an IR window with no apparent temperature differences; Figure 15 shows images with issues due to connections, load imbalance, etc.
You need to have confidence in the Infrared Viewing Windows that you are using! They are designed to allow infrared energy to transmit through them at a known transmission rate; therefore, if there is even a slight temperature difference, you will be able to see that with your IR camera, and be able to record images for the IR inspection trend analysis program.
Fig. 14: Images taken through IR Viewing Windows showing no apparent faults
Fig. 15: Images taken through IR Viewing Windows showing issues due to load imbalance, connections, etc.
How do I Use Infrared Viewing Windows ?
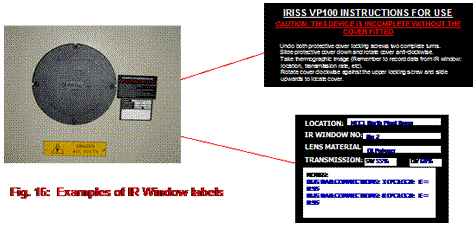
An important thing to remember when using IR Viewing Windows is to identify the Viewing Window with a unique number. This will be invaluable, especially when you have multiple Viewing Windows on electrical panels, etc. It is also advisable to identify the type and wavelength of the Infrared Viewing Window material.
The most essential data to record are the transmission rate of the IR window and also the emissivity of the component or components that you are measuring through the IR Viewing Window. The most effective way of using IR Viewing Windows is to, where possible, prepare all components that are inspected so as they have the same emissivity, with electrical tape, paint, etc. Thus, all components being inspected will have the same transmission rate and emissivity readings, and consequently, the results gathered will be more accurate.
It should be noted that there may be multiple targets through the IR Viewing Window. These need to be recorded on the ID label. The most common method of locating the targets required is by using the clock face method, i.e. bus bar connections at 4 o’clock, etc. These data can all be placed on labels, examples of which are shown below in Figure 16.
Note
Some cameras do not have the ability to adjust the external optics transmission, therefore, thermographers use the emissivity settings on the camera to offset for transmission and emissivity losses. The formula for this is to multiply the target component’s emissivity by the IR transmission of your IR Viewing Window. If you are using this technique you can use the labels to record the emissivity setting for the camera when using the specific Viewing Window.
Summary
IR Windows are a risk management device – not a protective device. THEY CANNOT GIVE YOU TOTAL PROTECTION FROM AN ARC FLASH EXPLOSION. They will, however, allow an IR inspection to be completed live, safely, and with no interruption to process. As such, this allows for more inspections to be completed and reduces the risk of equipment failure through routine monitoring and predictive engineering techniques.
The additional benefits of using IR windows are:
• IR windows remove the risks and costs associated with live inspections
• Help thermographers to comply with the requirements of NFPA 70E while conducting live inspections
• IR inspections can be completed at peak loading times on all switchgear
• Allows for one thermographer to complete the survey, thus reducing the traditional high manpower costs associated with live IR inspections
• Their use in a thermographic inspection program removes 99% of the triggers for arc flash incidents while improving electrical safety by allowing safe, regular infrared inspections of energized and loaded electrical switchgear
The benefits of using IR windows are many; they make our work as thermographers safer, faster and more accurate. Switchgear manufacturers are also realizing their benefit as a part of the IR inspection of switchgear and are fitting them as standard in some of their product ranges.
There are, however, still areas that need addressing. Thermographers and industry representatives need to work with IR window manufacturers and testing bodies to produce a code of practice and manufacturing standards that the whole industry can reference and adhere to. Once we have this standard in place, a lot of the perceived issues relating to IR windows will be addressed and the IR window industry will have its own standard to reference and update as required (instead of using the standard in place for viewing panes), thus ensuring that IR windows are manufactured, installed and used correctly EVERY TIME!!
About the Author
Martin Robinson is a Level III thermographer and is the designer of the IRISS range of IR Windows and thermography support products. He is also a member of the British Institute for Non Destructive Testing Infra Red training working group which is the committee that is responsible for establishing the training standards and working practices for thermographers in the UK.
Visit out Sponsors:
Electrophysics


Advertisement

