
Gregory R. Stockton, President
RoofScanIR.com a division of United Infrared, Inc.
PO Box 1403Bonsall, CA 92003 www.unitedinfrared.com
Abstract
While an enormous amount of infrared techniques to look at building efficiency have been developed in the past, recent new testing combining aerial infrared surveys, handheld infrared measurements, pressurization and computational analyses have been developed, with some surprising results. These testing protocols and the results now point the way to suggested changes in the construction of “Big Box” buildings, the repair and weatherization of existing commercial buildings, and a methodology for prioritizing optimal solutions, based upon the net present value of any efforts for improvement relative to projected energy costs.
This paper will explore large big box commercial retail building design flaws and construction defects. These buildings of between 100,000 and 200,000 square feet typically have slab floors, flat or low-sloped roofs and 20’-30’ high walls. These buildings look like big boxes, hence the name. Design and construction, HVAC and lighting issues will be discussed, but no attempt to address energy usage issues such as water heating, refrigeration, computers and office equipment, or other energy uses in these buildings.
Introduction
For more than 50 years, companies have developed or tried to develop techniques to lower the energy costs for operating these buildings by trying to understand where the energy is lost, where energy is consumed, the best ways to minimize the use of energy, the relative costs for the reduction of energy, and various financial measures to evaluate optimal solution alternatives. Table 1 shows a representative display of information from the U.S. EIA’s most recently published Commercial Building Energy Consumption 2003 Survey (the 2007 Survey has still not been published).
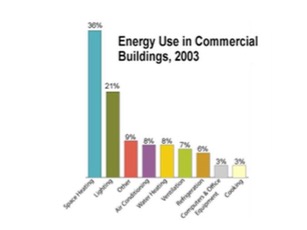
Survey [1]. (Source: U.S. Energy Information Agency)
Discussion
Defining the Problem
As world energy prices continue to fluctuate along an upward trend line, owners of buildings, property managers, state and federal agencies, commercial real estate brokers, among others, are being driven to require more energy efficient buildings, continuous energy improvement programs, financial analysis of energy efficiency, and periodic verification of building operational performance. For example, Table 2 shows the impact of various numbers of air changes per hour which building operators might find important. Monthly space heating costs are shown for an outside temperature of 40°F with an inside temperature of 68°F and a relative humidity of 60% for a 100,000 square foot building with an average wall height of 30 feet.
There needs to be a cost-effective way to holistically verify energy certifications and financially prioritize corrective actions if the energy consumption of the building is less than optimal. Building certifications are not the answer as they often do not include commissioning of the building at all. Case in point: we surveyed a government-funded LEED certified building which should have produced no more than 3 ACH (air changes per hour)…it produced 13 ACH. Missing, misplaced and wet insulation, huge air leaks in building walls and roofs are not only commonly found – they are typical of big box stores and most buildings.
The problem is significant!
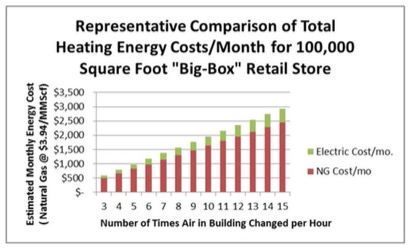
store as compared to air changes per hour.
Qualitative v. Quantitative
Many professional infrared thermographers are skilled in conducting blower door tests and infrared imaging of the walls, ceilings, windows, and doorways of residential buildings from the outside and the inside of these buildings. However, commercial, industrial and institutional buildings are much more difficult to survey. The size and complexity of larger buildings make it especially difficult to qualify heat loss and air leakage, much less quantify it.
Infrared surveying of the outside of large buildings will sometimes yield usable results and point the thermographer to problem areas on the inside, but often the façade [or surface] of the outside of the building is decoupled from the heat loss and air leakage of the building, either by air gaps between the façade and the building, by ventilation, by insulation or by being so reflective that they are difficult to measure with IR sensors.
In order to accomplish building heat loss surveys, the building must be “set up” so that one can create the conditions necessary to see problems. So, “wholesale” surveying of a campus or group of large buildings from the outside may not yield much useful information if not performed at just the right time, under just the right conditions and in a controlled manner.
The imagery approach is qualitative; it identifies and locates problems based on their anomalous heat signatures. This is much easier to accomplish, but this method does not quantify the amount of energy loss. In order to develop quantitative information, additional work is needed in the form of additional field efforts in the infrared data acquisition phase, combined with heat transfer analysis…a much more costly proposition. To understand the quantitative approach, it is necessary to understand how heat moves and the factors affecting its transfer, as well as the physics involved in determining what the infrared signatures are presenting. In order to know exactly what the radiated energy of any object is, the characteristics of the sensor, atmosphere and the target must be taken into consideration and one must know the transmission, emissivity and reflectivity of the target. There are big differences in the emissive qualities of various building materials. The ability to obtain quantitative measurements is built into radiometric imaging systems, but one must use a radiometric infrared camera to collect the imagery, and in a form that can be post-processed.
Heat energy moves by conduction, convection and radiation. In order to make meaningful quantitative thermal calculations, complete thermal properties of all the materials (specifically heat capacity, thermal conductivity, and density) must all be known and made part of the calculation. In our experience, as-built drawings and thermal properties are usually not available. This generally means that estimates of the heat loss, implications of temperature values obtained, and quantitative evaluation of the building’s performance can only be developed as estimates.
Even though some large format thermal imaging systems are fully capable of accurate radiometric measurements and rapid frame-by-frame digital temperature data acquisition of every pixel of every IR image, the cost of quantitatively gathering measurements and using steady-state and transient heat transfer analysis calculations (typically done with finite element analysis), make quantitative measurement a much more expensive step than simply using the image data to make judgments based on the experience of the person analyzing the thermal data. So most of the time, identifying heat loss and air leakage is pretty straightforward, but making calculations regarding insulation effectiveness and other qualities is an additional step that adds much cost.
Existing Big Box Thermal Performance
Insulated Masonry Walls
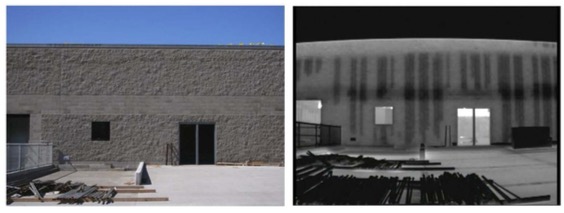
Most big box stores have tilt-up concrete panels or single-wythe concrete block walls (8” or 12” CMU or Concrete Masonry Unit). Infrared imaging of these large building walls under construction to find missing grout, structural components and insulation is a well- understood, if an underutilized technique. Figure 1 shows examples.
The inside walls sometimes have wooden or steel framed walls reaching the level of the uninsulated suspended ceiling, but often are only painted inside surfaces directly on outside walls without any interstitial space full height. Wherever there is a door, window or other opening in the wall, or wherever there is solid grout or a solid structural component, there is very little insulation value.
In any case, these buildings are not designed to be pretty, durable or energy efficient.
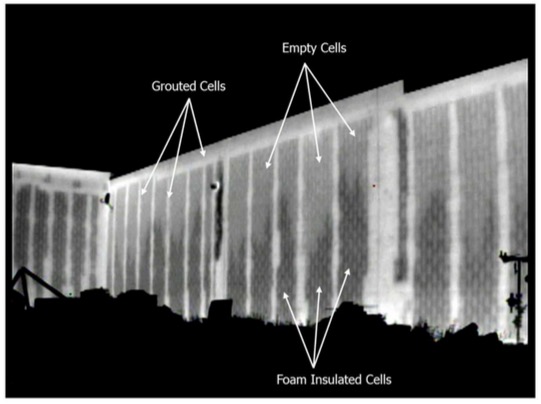
empty and insulated cells shown.
Insulated Roofs
If one takes the total surface area impinging on the outside world as a gauge for potential heat loss, the roof definitely has the largest energy loss potential. Also, roofs are perpendicular to the Sun during the day and the night sky (outer space) at night. As shown later in this paper, most of the energy in big box stores goes out of the roof.
BURs (built-up roofs) used to be the most popular way to cover a large building, but that has changed over the past twenty-five years. Properly maintained, a BUR will last over 30 years, but cost significantly more to install. Big box retail stores generally have a life expectancy of 10 years, since the store will either be removed from the area if sales do poorly, or a new larger store (at a close-by location, or major addition and renovation) will take its place if sales do well. So, owing to the more expensive installation and the fact that retailers do not need 30-year roofs, single-ply membranes have become the roof of choice for big box stores.
Typically, the roofs of most big box stores are a single-ply membrane (mechanically fastened or fully adhered), with a couple of inches of closed-cell foam board insulation (commonly polyisocyanurate) over a metal deck welded to the steel bar joists. Because of their higher reflective qualities, white TPO (thermoplastic polyolefin) has become the roof membrane of choice lately due to roofing manufacturer’s strong marketing efforts and government incentives to use these “green roofs”.
After 4-5 years, the membrane and insulation deteriorate at a fast rate due to UV rays from the Sun striking the roof and from thermal shock, caused by rapid heat-up (when the Sun hits the roof) and rapid cool-down (from rain falling on the highly heated roof). As the seams and flashings begin to fail, rainwater and condensation begin to seep under the membrane and into the roof substrate to be trapped or leak. This water is either absorbed into the insulation (around the edges first), trapped between the membrane and the insulation, or dripped into the building through cracks in the steel decking. This too is a well-developed infrared predictive maintenance technique (see Figure 2). Wherever the insulation is wet, the mass and therefore heat transfer characteristics are increased, making the insulation essentially ineffective and therefore, the roof less energy efficient.
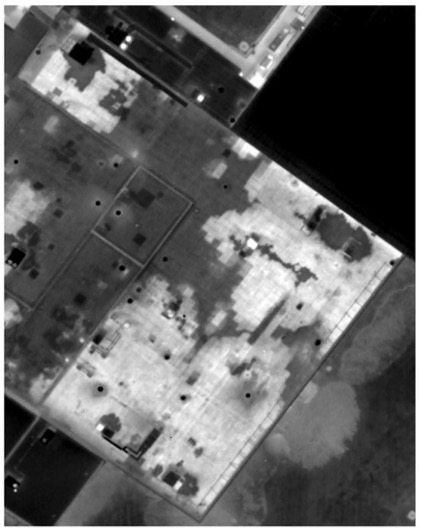
saturated board insulation.
New Approach to Big Box Thermal Performance Testing
Over the years, many energy efficiency companies have provided a plethora of solutions for buildings ranging from computer controlled devices, control algorithms, alternative energy add-ons and such. Many of these approaches have yielded energy efficiency improvements with varying degrees of success. So with a well- developed set of vendors and proven techniques, why do we need any improvements in how infrared imaging is performed on buildings?
Since the floors are almost always a monolithic poured concrete slab, this leaves only the walls and roof to improve the thermal envelope, moisture envelope and air barrier, which, by design in big box stores, are the largest problems with energy efficiency. Without the significant investment to cover them from the inside or outside, single-wythe block walls themselves leave little room for improvement, since the walls are often weight-bearing and structural, so they must contain solid strong components which have little insulation value. Figure 3 shows a CMU wall with typical grout spacing at 40” on center. As shown, the total area of possible insulation is much less than half of the total wall area, since bond beams, expansion joints and openings must contain extra reinforcing due to structural and seismic code requirements. Even the solid rib part of individual blocks offers increased heat transfer as thermal shorts. As shown in Figure 4, air can leak at the roof to wall intersections and doors.
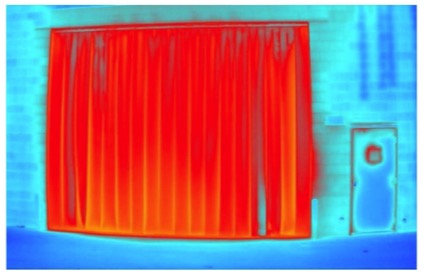
Roll-up doors are always extremely leaky (see Figure 5). So, the floors offer little chance of improvement and unless the walls are redesigned structurally and/or covered and door openings converted to sealed and converted to a fast roll-up type – other than roof to wall intersection sealing to stop thermal shorts, there is little low-hanging fruit with respect to the floors and walls. That leaves the roof…
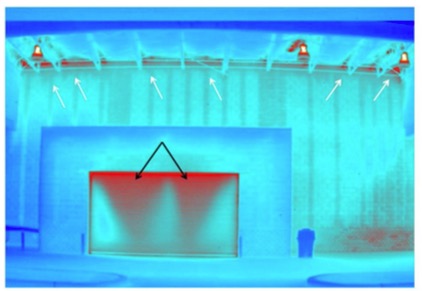
(white arrows) and door (black arrows).
New Approach to Big Box Thermal Performance Testing
Roof Pressurization Testing
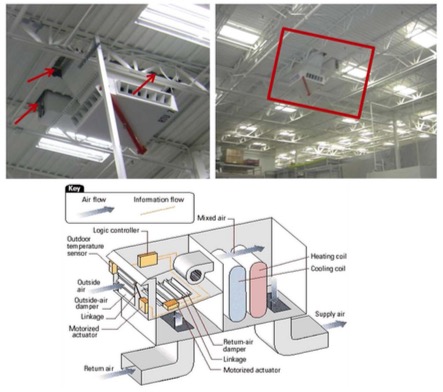
In early 2010, one of our longtime clients asked us to assess the energy efficiency of a couple of their “typical” big box retail stores and make recommendations as to how to improve the design. Knowing pretty much all the above already, we focused on the roofs and areas just below the roofs, since they offered the best return on investment (ROI) for redesign and retrofit for energy improvement. The testing was first conducted on a single store. The HVAC system was controlled from a remote location. We measured the relative humidity, pressure and temperature and compared them with the values supplied by the controls personnel, and the values matched pretty well, even though steady-state normal operation was a slight negative pressure, which really bothered us. Pulling in excessive amounts of unconditioned outside air into any building is inefficient and a very bad idea because the outside air has to be conditioned and importantly, moisture problems develop from this practice. In this situation, the HVAC systems consisted of RTUs (roof top units or package units) that condition the air by bringing in outside air (controlled with a damper system) and conditioning it with either a heating or a cooling coil (see Figure 6). After reviewing the plans and specifications, we noted the exhaust fans removed air at a higher rate than the air pulled into the building by the HVAC systems in many areas. This was a perfect precursor condition for our tests because we did not want any positive pressure during the “before pressurization” test, so that we could measure the differences between heat losses and air leakages between negative and positive pressurizations of the buildings.
We wanted to compare the zero pressure condition (before pressurization) with increased pressure condition (after pressurization) to see if we could find leaks (heat and air), and if so, where they were occurring. We first took measurements and infrared surveyed the inside and outside of the walls and roof and flew over the roof with a high- resolution infrared imager. Then, we had a mechanical contractor “zip-screw” shut the dampers on about half of the RTUs so that we could raise the pressure in the building to ~25 Pascal (0.1 inch of water). Before pressurization, heat loss was evident in the form of heat between the board insulation and around the RTUs (Figure 7). After pressurization, we took the same readings and again surveyed the roof (from the top of the roof and from underneath the roof), the walls (from inside and outside) and the doors and openings (from inside and outside) and again flew over the roof (see Figures 8 and 9). Since we had six thermographers on-site and an airplane crew overhead, the entire data collection process took little more than an hour.
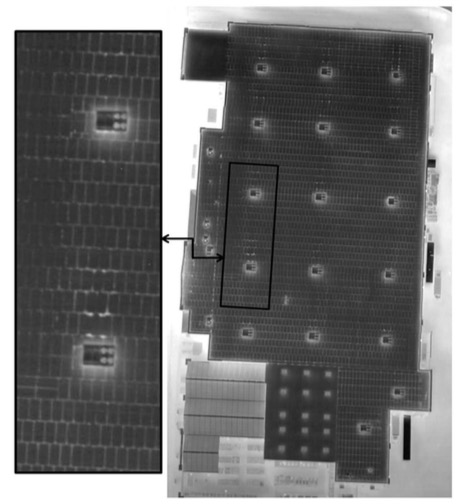
heat loss between the board insulation and around the RTUs.
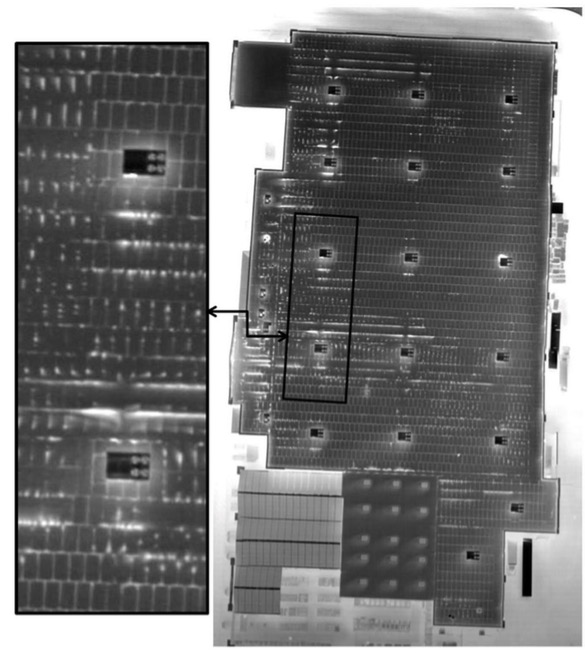
heat loss and air leakage between the board insulation and around the RTUs.
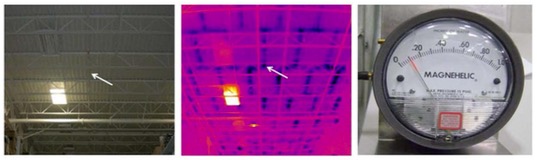
roof taken during pressurization and pressure gauge reading during building pressurization.
The results of the pressurization testing proved that a tremendous amount of heat and air are being lost in these big box stores through these “green” roofs. The recommendation was to seal up the RTUs with a better flashing system, install a moisture, vapor and air barrier between the steel deck (which is full of holes from the welding process) and the insulation boards and lay two 1.5” boards of polyisocyanurate insulation instead the single 3” layer. It should be noted that, as with any building material, even high-R, low-mass insulation boards, shrinkage occurs during cold conditions. It was also recommended that the insulation be installed during cold conditions to keep the boards tight during winter and summer, but owing to the fast- track construction schedules for these structures, that recommendation will probably not be followed.
Skylight Testing
Lighting in retail stores is critical, not only from an energy usage standpoint, but more importantly from a point of sale standpoint. Proper lighting produces sales, money and therefore profit, so getting it right is extremely important to the retailer. It is “green” to use to use the sunlight to illuminate one’s building and skylights offer a way to do that, but they also leak air, water and heat and the tradeoff is “free” light vs. higher installation costs, added maintenance costs, and added safety and security risks (from people falling through them or breaking into the building through them).
An aerial infrared test was arranged to compare the two sets of skylights; energy efficient and standard. Two stores were selected that were very similar with the exception of the skylight types. Store A has energy efficient skylights, which cost roughly $200 more per skylight and Store B has standard skylights. We surveyed the buildings under the same ambient conditions. As shown in Figure 10, the energy efficient skylights performed much better than the standard skylight. We are currently doing comparisons to determine the exact ROI of the energy efficient skylights, but the work is not complete at the time of this publication.
Highlights of the New Approach
- Developing detailed test plans, which include simultaneously conducting infrared and blower-door/ventilation system testing, estimating expected ACH, collecting information about the building space heating and cooling costs and designating the optimal time of the day and ambient conditions for all testing
- Conducting infrared assessments of the walls by capturing radiometrically-accurate high resolution imagery of the interior and exterior of the walls to detect heat loss, air leakage, entrained moisture and other energy losses
- Conducting aerial infrared assessments of the roof by capturing radiometrically- accurate high resolution imagery to detect heat loss, air leakage, entrained moisture and other energy losses through skylights, RTUs and exhaust fan systems
- Creating algorithms and protocols for prioritizing the value of the findings and where possible, prioritizing the financial and technical value of various solutions to mitigate detected problems
Future Development
We are developing algorithms used in modeling which will be the basis for a web-based energy benchmarking tool, allowing real estate managers, building owners and operators, governments and corporations to input their own information to create rough baselines of their energy costs, and then decide whether a systems engineering approach assessment would be worthwhile. Since the combined total of energy use in a commercial building is a combination of (space heating) + (air conditioning) + (ventilation) + (refrigeration) + (lighting) + (computer & office equipment, etc.), then a systematic infrared-based approach could potentially yield accurate estimates of expected energy usage, and accurately project savings estimates for design consideration and retrofit planning.
Conclusion
Over the past 30 years, we have found that most commercial organizations, government agencies, and building owners in general, have neither the time, expertise nor the inclination to accurately measure, assess, and evaluate the alternatives for reducing energy consumption in their buildings, but things are slowly changing. This new approach has been designed to take the next step beyond simple infrared imaging and provide more comprehensive and cost-effective energy efficiency measurement and assessments. If detection, analysis, and correction planning is not holistically accurate, complete and cost-effective, many buildings will continue to be operated far less efficiently than they should be operated. Cross-correlation of high-resolution aerial infrared imaging, with internal and external building infrared imaging, blower door testing and “should cost” energy costs analysis has now become commercially viable.
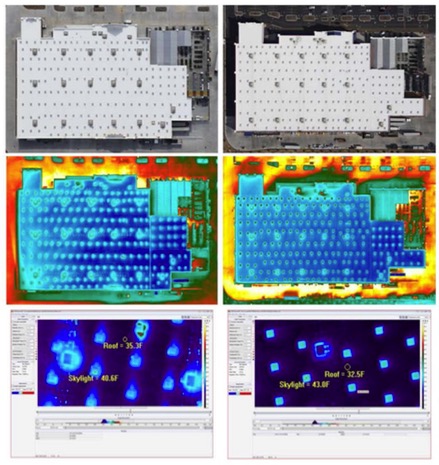
skylights perform much better. (Store A with energy efficient
skylights shown on left side, Store B with standard skylights shown on right side)
References
[1] U.S. Energy Information Agency, “Commercial Buildings Energy Consumption Survey commercial energy uses and costs”, http://www.eia.gov/consumption/commercial/.
