Frank Sinicola
GFI
1414 Outlook AvenueBronx, NY 10465Ph: 888-511-8721
Abstract
Most companies have a preventive maintenance program in place for the electric power system within their facilities. However, facilities can still experience disturbances or failure of switch gear and/or equipment that can affect their operation. This paper will provide a brief overview of problem and solution statements for several case studies. These solutions can save facilities money by implementing efficiencies to power usage and avoiding major damage to equipment.
The annual cost of power quality related problems are in the hundreds of millions. Although thermography is a good tool for identifying a potential failure, it is just one of the tools utilized in solving power quality (PQ) problems. Industry studies have indicated 80% of PQ problems are created within the facility, the remaining 20% are utility related, which include normal operational switching and power disturbances within the power supply. A power disturbance within the utility supply can amplify an existing condition within the facility. Facility related causes are improper wiring and grounding practices which are not in compliance with code. Another facility related cause besides the equipment itself is the effect of equipment on other equipment. Prior to reviewing the case studies we will discuss electrical basics and tips.
Introduction
“Power Quality is the set of limits of electrical properties that allow electrical systems to function in their intended manner without significant loss of performance or life”. (Wikipedia)
The case studies discussed in this paper are a collection of investigations performed throughout several years. They are meant to be a guide in understanding the possible causes and solutions of power problems. A PQ professional must utilize many tools in determining the potential problem. Some of the tools utilized are Infrared, Ultrasound, basic electrical code knowledge, electric magnetic field (EMF) milli-gauss meter, long term monitoring (voltage, amperes etc.) and the use of hand held volt/amp meter or ground tester. Equipment specifications and operating characteristics are also reviewed when investigating PQ issues.
Case Study #1
Harmonics – Hot Transformer
Real Estate Company Upper East Side
Subject: 500 KVA Federal Pacific 120/208/480v Step-up Transformer
Background
A building on the Upper East Side is supplied at 120/208 volts, three phase, four wire from the local Utility. The electrical design criteria for the interior distribution of this building called for two 500 KVA transformers to step the incoming voltage up to 480 volts. Transformers on upper floors step the voltage back down to 120/208 volts for general end-use utilization. At the management’s request, the Utility investigated and evaluated the overall conditions of these step-up transformers. The investigation was applied to one unit; however, the same methodology may be applied to other dry type transformers in the facility.
Findings
The step-up transformer investigated was manufactured by Federal Pacific Inc.
A visual inspection revealed the following:
Top of transformer slightly bowed
Paint peeling on top of transformer
Paint discoloration on top of cooling vents
Electrical monitoring was performed on the input and output of the transformer. The most significant item to note from this is that the transformer was loaded to less than 25% of its nameplate KVA rating.
Additional tests utilizing infrared and ultrasound technologies were completed on this transformer. The ultrasound test noted particularly noisy conditions on the middle phase. In addition, the infrared testing revealed temperatures on the middle phase in excess of 90° centigrade. Based on the ampere loading at the time of the infrared test, it is estimated that this temperature is approximately 50° centigrade higher than it should be for this loading level.
The visual inspection indicates elevated heat causing the paint discoloration/peeling and bowed top. It is also suspected that the winding laminations may have experienced some deterioration especially on the middle phase. It is recommended to review its integrity during next the maintenance cycle.
Recommendation
Since the loading levels and harmonic distortion measurements indicate that there should not be excessive temperatures, it is recommended that maintenance be performed.
We have evaluated the proposed maintenance procedure submitted to you by an electrical contractor. These are additional recommendations:
-
Particular attention should be given to cleaning top and bottom ends of winding assemblies, and to cleaning ventilating ducts.
-
Vacuum cleaning of the transformer windings is recommended as a first step. Additional cleaning should be done by dry compressed air or nitrogen at a relatively low pressure (not over 25 PSI). Care should be taken to maintain adequate ventilation during cleaning and to ensure that contamination is not driven deeper into the insulation.
-
Supports, terminal boards, and other major insulating surfaces should be brushed or wiped with a dry lint-free cloth. Liquid cleaners are not recommended.
-
It is recommended that all lug type connections, rather than being just retightened, be remade. Care should be taken to ensure proper cleaning, application of oxide inhibitor and proper torqueing procedures and values. Refer to the attached installation, operation and maintenance document from Federal Pacific.
-
We have reviewed the tap settings. Good practice would specify that the taps on the step-up transformers be coordinated with the downstream step-down transformers. Unless there have been specific recurring high or low voltage problems in your facility, we would recommend not changing the tap position. If you would like, we can assist you in verifying that the upstream step-down transformers have the proper coordinated tap setting.
Case Study #2
Recording Studio Nuisance Breaker Tripping and Wiring Error – Harmonics
Background
The facility is a karaoke recording studio that has experienced nuisance tripping of circuit breakers, voltage fluctuations and damage to recording machine circuit boards. A meeting was held and a power quality (PQ) study was performed. The studio was also concerned about electrical noise and ground hum that could show up in the recordings.
A single phase monitoring recording device was installed and a survey was performed of the electrical distribution panel on the 10th floor. The monitoring device installed recorded two days of electrical characteristics. Spot readings on each phase were also taken.
Survey Results and Recommendations
Harmonic readings were taken at the main distribution panel. Sample readings of 18 amperes indicate a 75% to 80% harmonic current on a twenty ampere circuit breaker. Harmonics are a contributing factor to nuisance circuit breaker tripping. The three main breakers appear to be running hot, especially the right-most phase. Breakers on the left side of the panel are placed in every third location which is the same phase that is elevated in temperature, the right most main circuit breaker. Placement of these breakers is the contributing factor to the hot running breaker, creating harmonics and nuisance tripping of circuit breakers. Other circuits in the panel utilize a shared neutral. Mechanical grounds are utilized for the riser to the main distribution panel.
Balancing the load on each phase will help to eliminate neutral current and the overheating of the circuit breakers. It is recommended to verify the loading of each phase during a peak load cycle.
Overloading of the neutral can create premature failure and a fire hazard since it is not fused and can carry as much as 2 times the current of the phase conductor. Shared neutrals are connected to single phase circuits that have multiple phase conductors; the result is a neutral carrying the unbalanced current. Avoid running circuits with shared neutrals.
All wiring must comply with New York City code requirements. Single point grounding is necessary for performance of your type of equipment. Only one neutral to ground bond should exist at the service entrance or at a newly derived source. Isolated or dedicated grounds must be tied to the building ground to assure low noise levels.
Routine maintenance should be performed on your terminations, by tightening all connections in the distribution panel as well as on the receptacles throughout the facility. Reversals or incorrect terminations can cause electrical noise that can contribute to the problems experienced with recording equipment.
Case Study #3
Process/Problem: Premature Failures of Motors Driven by ASDs
Power Quality Investigation at Organic Fertilizer Co.
Background
Organic Fertilizer Company (OFCO) has experienced problems with premature failures of motors that are powered by adjustable speed drives (ASD). In addition to motor failure problems they have experienced Silicone Control Rectifier (SCR) failures, fuse failures, and drive control card failures due to voltage sags. OFCO has requested assistance to identify the root-cause of these problems and provide recommendations on how to minimize these problems.
Site Visit
The objective of the site visit was to gather information from OFCO personnel regarding the nature of the problem, identify drive/motor configuration and electrical information, and take necessary power quality measurements to diagnose the problem. The information gathered from the site visit would be used to recommend corrective actions required by OFCO in order to mitigate these problems.
The following background information regarding the problem was provided by the plant manager during preliminary discussions:
-
They have experienced 14 motor failures in the last two years. The premature failure of motors controlled by ASDs is the main problem. The damage of SCRs drive control cards due to voltage sags are not that frequent and the investigation team was asked to focus primarily on the motor failure problems.
-
OFCO has 6-350 HP motors and 6-400 HP motors controlled by Siemens and Robicon current source drives. These drives/motors are used primarily for fan application, e.g., ID fan. The motors are supplied by Siemens and US Motors. Appendix A provides the name plate data of the motors and a general description of the Robicon and Siemens current source drives.
-
The length of cable from drive to motor varies from 40 to 250 feet. There is no correlation between motor lead length, the type of drives and motors, with regards to premature motor failure. The failures seem to be random in nature.
-
During the installation of the facility, several small motors (5 HP) controlled by ASDs experienced insulation failures. These problems were solved by installing a reactor between the motor and the drive. The same approach was tried for one of the 350 HP Siemens drives. However, this did not solve the current problem.
-
The standard procedure currently implemented at OFCO is to send the failed motors to a motor repair shop. However, there is no record of any type of failure analysis conducted on the motors by the repair shop. The logs sent by the motor repair shop indicate the date when a motor was received and the date when a motor was sent back to OFCO. The failure analysis of motors is a critical piece of information that OFCO needs to obtain from the motor repair shop.
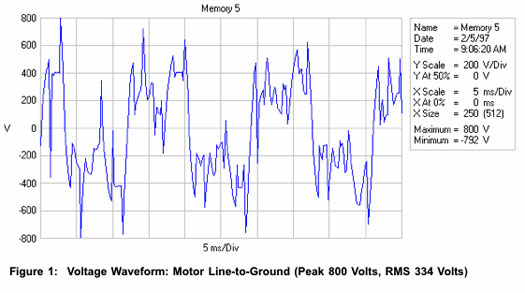
Electrical Layout and Motor Terminal Voltage Waveform
The facility is served by a network, with grounded-wye transformers. Measurements at the motor terminal show that the line-to-ground rms voltages are approximately 340 volts with a peak voltage of approximately 800 volts (Fig.1). This clearly demonstrates a higher line-to-ground insulation stress on the motor side of approximately 2 pu of nominal voltage. This high voltage on the motor side is a result of ‘neutral shift’ phenomenon that is associated with current source drives connected to a grounded neutral system. Measurements of line-to-ground and line-to-line voltages at the drive input (supply side) were within the expected range (277V, L-N & 480V, L-L).
Analysis
Motors controlled by ASDs are subjected to higher insulation and thermal stress due to the non-sinusoidal nature of the voltage applied to motors. The severity of this stress depends on many factors, such as topology of ASD, installation issues (e.g. cable length), motor loading & speed, etc. Following are three basic motor problems that are associated with drive application:
Thermal Impact: The harmonic distortion in the drive output voltage results in harmonic losses within the motor that may increase the operating temperature. Also, operation of the motor at a reduced speed impacts the cooling ability of the motor resulting in an increase in temperature rise. The thermal stress of motors is primarily associated with six-step voltage source drives. NEMA MG1-Part 30 has established de- rating curves based upon harmonic content of the line voltage.
Standing Wave, dv/dt Impact: The most commonly used ASDs in the <200 HP range is the PWM drive with IGBT inverter stage. The applied voltage waveform consists of voltage pulses with rise time that may be in the order of 0.1 usec. These fast rise time voltage pulses interact with the motor cable lead and can produce a voltage doubling effect at the motor terminal resulting in turn-to-turn motor insulation failure. NEMA MG1- Part 31 has established a criterion for definite purpose inverter driven motors to withstand 1600 Volt pulses with rise time of > 0.1 usec. The voltage doubling effect is directly correlated to the cable length and can be corrected in existing applications by using various types of filter devices, which are commercially available.
Neutral Shift Problem: Motors controlled by current-source drives using DC link reactors can be subjected to higher voltage stress to ground due to a phenomenon known as neutral shift. This neutral shift problem occurs for current source drives which are connected to a grounded neutral system. The cause is due to the difference in the source side neutral voltage and motor neutral voltage. Due to significant filtering effect of DC link capacitors, voltage source drives are not known to cause this neutral voltage shift. This higher than normal voltage stress has led to the failure of motors causing dielectric insulation breakdown in the motor’s phase-to-ground insulation. This problem is often intensified when the motor is running at rated speed. The effect of grounding the motor neutral instead of the supply neutral is to transfer the higher voltages to ground to the transformer side of the circuit. This may be a superior configuration particularly in retrofits where a new transformer is likely to be supplied and is specified to handle the higher voltages to ground. This problem, unlike the dv/dt problem cannot be solved by adding reactors on the output of the drive.
Diagnosing Motor Failure Problem at OFCO
Based on the investigation and the information given to us by OFCO personnel it is our opinion that the premature failure of motors at OFCO is related to a ‘Neutral Shift’ Problem. This conclusion is based on several observations that are outlined below:
1. The drives are current source drives (CSD) and the supply neutral is grounded
2. Voltage readings to ground at the motor terminals are high (334 volts)
3. The drives are mostly operating at rated speed
4. There is no correlation with lead length, motor/drive vendor and motor failure
5. The use of reactors with one of the Siemens’ drives did not have any impact on the problem
Specific Recommendations to OFCO
The problem currently experience by OFCO is the result of improper system integration of drives with motors. CSD manufacturers are aware of the neutral shift problem on grounded neutral supply systems. One manufacturer of CSD drives informed us that based on the nameplate data of the motor, matching filters can be provided. In retrofit applications, grounding of motor neutral is often a better configuration. Since this would transfer the neutral shift voltage to the line side, a new transformer can be specified for the higher voltages to ground. It is also possible to use motors that have a higher voltage tolerance when system grounding has to be done on the supply side.
In the case of OFCO, it is not feasible to rearrange the system ground at this point. Also, due to space limitations, new larger motors with higher voltage withstand capability cannot be used. The best option is to increase the dielectric strength of the existing motors when they are sent out for repair. However, before attempting to upgrade the existing motor insulation system OCFO should perform a failure analysis on one of the failed motors. Most reputable repair shops would be able to modify the existing insulation with a combination of the following alternatives:
-
Use magnet wire with increased dielectric strength. Phelps Dodge Magnet Wire Company has developed newer inverter grades of magnet wires that demonstrate higher dielectric breakdown strength that significantly increases life capability.
-
Improved insulation on end-turns, in slots and between phases
-
An additional coat of varnish, preferably a 100% solid epoxy type, applied to the coil heads
-
Heavy duty lacing or taping of end-turns
-
Using Class H insulation
These improvements would be required to upgrade the existing insulation system of the motor to meet NEMA MG1 Part 31 which specifies characteristics for “Definite Purpose Inverter-Fed Motors”. Motors meeting this standard can withstand a maximum of 1600V spikes with rise times of greater than 0.1 usec. Some inverter duty motors were designed only to withstand the thermal stress, but still use the same 60 Hz insulation system. When purchasing inverter duty motors, clarification should be requested from the vendor to ensure that it meets the requirement for NEMA MG1-Part 31. All inverter duty motor quotations shall reference compliance to NEMA MG1-Part 31 to ensure increased dielectric withstand capability.
It is imperative for OFCO to obtain failure analysis data from the motor repair shop. This data would indicate whether the insulation failure is a turn-to-turn failure or phase- to-ground failure. The failure analysis would determine the type of insulation upgrade required to mitigate this problem. Manufacturer of U.S. motors has agreed to look into this matter. The motor insulation upgrade on the existing motors is the recommended alternative in mitigating the insulation failure. We do recommend OFCO to contact Manufacturer.
Motor and Drive Information
|
Inverter Duty Motor |
Premium Efficiency |
|
Model: G63109 |
PE-21 |
|
Insulation Class: F |
ORD No 3-5100-LR1S210-1 |
|
Design: B |
Service Factor 1.0 |
|
Code: G |
Class Insul: P |
|
Frame: 447T |
Code: S |
|
HP: 350 |
HP: 350 |
|
ID: V11V2120452R-1 |
Design: B |
Siemens Drive
Current source drive with SCR converter and transistor inverter
The input stage is comprised of three diodes and three SCRs in semi-converter arrangement. The DC-link has two reactors in +ve and the –ve leg.
Configuration of Siemens Current Source Drive used in OFCO
Robicon Drive current source inverter with SCR front-end and SCR inverter
Case Study #4
EMF Wiring Errors Grounding: Real Estate Value, Power Quality & EMF A Case Study Of Relationships – Both Technical And Political
It is often said that electric and magnetic fields (EMF) are the natural consequence of the use and distribution of electricity and that these fields are unavoidable. Further, that in order to eliminate these fields from our environment, society would have to abandon the convenience of electricity and return to oil lamps. No one seriously considers such an option, for obvious reasons, but also in part, because the field levels that one generally encounters in the world are not sufficiently troublesome to cause great concern.
It is worth knowing that the typical office building will have background magnetic field levels in the range of 0.5 mG to 4.0 mG. (Although EMF, strictly speaking, is electric and magnetic fields, the issues confronting real estate developers and building managers are almost exclusively related to magnetic fields, since most building materials easily shield electric fields whereas magnetic fields will pass undiminished through virtually all materials).
It is also worth knowing that although under certain circumstances field strengths as low as 3 mG can cause problems with some electronics, the majority of concern begins with computer monitors, which typically are most sensitive above 10 mG. When one uses the term “elevated magnetic fields”, these are the ground rules – the context in which to place these terms – any background field greater than 10 mG, across a large area is cause for concern.
At times, the source of elevated magnetic fields in a building is known and easily seen – as in the case of a passing electrical transmission line. More often, it is much more complicated than that and much harder to identify solutions to reduce the problem. The following example is one of these more common and more complicated problems.
The Problem – A Moving Target
Elevated EMF levels in a ground-floor space of a Class-A building in Westchester County, New York, had rendered the space unusable for most types of computer use. Prior tenant complaints and a cursory evaluation of the site by the building engineering staff concluded that the problem apparently came from elevated magnetic field levels from the building’s electricity feeds.
At this point, when the issues of the consequences of elevated magnetic fields were being assessed, and the decision to take corrective action was made, the participants did not know the complexity of the problem, much less that in the course of its solution, other seemingly unrelated but far more potentially dangerous problems would be uncovered.
The building facilities engineering department contacted the Power Quality Group from the local utility to verify field levels and to propose corrective strategies.
After review of the data, the building hired a Los Angeles based EMF specialist, to support the Power Quality Group in its analysis and to help sort out the problems. As each step of the work progressed, it became clear that the fields were produced by a variety of sources and conditions, both ordinary and inexplicable.
Eventually, the full analysis would reveal that the sources came from:
-
Wiring errors in the upper floors of the building. These violations of Code were causing return current to travel on grounding conductors and building steel, throughout the building.
-
High current conductors in the 460V Network Protector Vault at the edge of the building, below grade.
-
High current conductors in the building transformer vault and switchgear facility below the space.
-
Multiple ground paths in the 460V Network Protector and switchgear room, creating unusual field levels above the vault.
-
The neutral bus connection in the main distribution panel had been improperly and dangerously installed.
Not all of these sources were obvious at the beginning of the process – some became visible only after the others were substantially eliminated and some were revealed as a consequence of the attempt to correct others. Each had its own unique set of mitigation possibilities and many were intertwined and interdependent. For example, although the fields from a high current conductor are fundamentally not distinguishable from those from a net-current wiring error, the available mitigation strategies are quite different. Those from a high current conductor or circuit can be successfully shielded, given the right material and design. Those from the net-current cannot be shielded by ordinary means. The consequence of this is that before an effective shield can be designed, it is first necessary to eliminate (or substantially reduce) the fields from the net-current condition. Put differently: the cause of the net-currents must first be corrected before an attempt is made at shielding.
This is one of the basic operating principles of a successful mitigation effort.
At the beginning of the efforts to reduce these elevated fields, there were few places within the space that would have allowed the productive use of computers – the field levels were simply too high. The first general survey of the fields, performed by the Power Quality Group established the baseline against which all mitigation efforts would be measured.
Average Field Strength, Without Mitigation Measures: 30 mG
Peeling the Onion
As is often the case, the problem is amenable to a phased approach, starting with the more obvious or physically accessible sources and proceeding toward the more intractable and more complicated sources.
In our example, the place to start was with the wiring errors on the upper floors, beginning at the top floor and working down toward the vault. This is painstaking, time- consuming work, involving the most elemental examination of wiring practices, all the while recording changes in the net current levels in the vertical riser conduits feeding from the main distribution switchgear in the basement. At the beginning of the work, the main distribution circuits had a total of 48 amps of net current. After corrections were made, a process that required several months to complete, the levels had been reduced to 3 amps.
Remarkably, the gradual reduction of net currents in the building had little effect on the magnetic field levels in the commercial space. Indeed, at the end of the process, the average field levels in this space had actually increased from 30 to 35 mG.
The process of wiring correction revealed an alternative path for the return current – the building steel had been carrying return current directly to the transformer, bypassing the return neutral conductors and the basement switchgear. This corrective work inadvertently revealed a dangerous flaw in the electrical system.
Following weeks of wiring problem resolution, the Power Quality Group was called to the building on an emergency. On a routine inspection, the building engineer discovered that the bolts on the neutral bus inside their switchgear were cherry red and smoking. Now that the current was flowing on the neutral bus as it should be, the bus was being overheated – revealing the fact that the bus connection had been improperly installed. Prior to the wiring corrections on the upper floors, a significant portion of the return current was flowing on the grounding conductors and the building steel, and a potentially dangerous installation error went undetected. The EMF investigation illuminated the danger. The Power Quality Group provided support and guidance as a temporary shunt was installed to immediately alleviate the hazard. The building engineer later installed a new bus bar and the bus connections were permanently corrected.
Average Field Strength, Reduced Building Net Currents: 35 mG
The Problem Moves
These efforts resulted in a significant reduction in net-current condition present on major circuits originating from the basement distribution equipment. However, although the correction of the upper floor net-currents reduced the level of the net currents throughout the building, and the background magnetic fields in the upper floors, the reduction in magnetic fields in the area of concern was less than the computer model had predicted, particularly in those values which appeared to be coming from the direction of the computer vault and switchgear rooms below the space. As part of a more detailed analysis, an EMF specialist created a map of the current flows inside the switchgear rooms. This produced a model which revealed that the current flows were producing high levels of magnetic fields as a result of the presence of an alternate, parallel neutral current path between the Utility transformer and network protection vault and the neutral-to-ground bond in the building’s main distribution equipment. Approximately 40 amps of neutral current were found to be flowing on building steel components, between the transformer/network protection vault ground point and the main distribution equipment neutral-to-ground point. This condition produced characteristics of a net-current circuit condition contributing to elevated magnetic field conditions in the street level tenant space which, like those produced from wiring errors on the upper floors, could not be mitigated or reduced by shielding measures.
The computer model suggested that the most efficient solution to this new problem was to modify the existing grounding connections in such a way as to encourage the currents to flow on a single path and, in such a way as to maximize their capacity to self-cancel the currents normally in the vault and switchgear room. These changes could not compromise any safety requirements nor could they violate any Utility transformer vault construction policies. Accordingly, a technical assessment of the options was undertaken by the various parties (the building management and engineering, Utility Power Quality Group, EMF Specialist and Utility Distribution Engineering) that resulted in a scheme which satisfied all of the participant’s goals.
As a result of that agreement, the building engineering staff installed two additional grounds from the building switchgear to the building steel and an additional ground to the building cold water pipe. After these additional grounds were in place and verified by Utility Distribution Engineering and the Power Quality Group, the original ground connections were removed by the Utility. Measurements by the Power Quality Group verified that the 40 amps originally running on the ground system had been reduced to 4 amps. More importantly, this reduction had been achieved without compromise to the integrity of the building’s electrical system design or to the principles of safety and reliability that were of concern to all participants.
Subsequent measurements confirmed that net-current circuit conditions were minimized and magnetic fields in the affected street level tenant area proportionately reduced.
Average Field Strength, Vault Net Currents Reduced: 20.3 mG
Magnetic Field Shielding
The net currents in the building had now been sufficiently reduced to enable the productive use of magnetic field shielding.
In preparation for the design of a custom shield, the EMF Specialist performed a detailed survey of the mechanical and electromagnetic characteristics of the space. The survey data were utilized to develop a choice of mitigation plans, each of which was guaranteed to reduce magnetic field strength levels in the affected area to a target range of 2-6 mG. In an effort to keep the project costs at a minimum, the plan selected by the building entailed a 2-phase project. The first phase would lower the majority of the field locations to the target level, but would allow for the possibility that slightly elevated fields would exist in some areas closest to the windows. The building management chose this approach in the belief that it would be possible to design the use of the space such that these elevated levels, if any, would be irrelevant. The second phase of the project, if required, would eliminate these elevated fields by shielding areas near the network protection vault.
As predicted, the first phase of project shielding resulted in an average field level throughout the area of 6.4 mG, slightly above the target range of 2-6 mG, and the result of elevated fields near the widows of the main floor. The owner and tenant agreed that the reduction to these residual field strengths were sufficient to the needs of the building and their prospective tenant, and the second phase, though still available, was considered unnecessary.
Average Field Strength, Shielding & Net Currents Reduced: 6.4 mG
Conclusions
Resolution of these problems required close coordination and a successful technical negotiation between the building management, Utility Power Quality Group, EMF Specialist and, since the final resolution would require a change in grounding patterns, participation and agreement with Utility Distribution Engineering.
Moreover, the resolution of this complex problem illustrates the relationship between unusual EMF levels and Power Quality issues and, as importantly, demonstrates how a local utility can and will explore creative new ways to serve the customer.
Case Study #5
EMF (Elevated magnetic fields) Corporate Systems & Maintenance
ELF Magnetic Field Survey Report of a Publishing Company – Offices: 6C-26, 6C- 21 and 6C-27
The following are the results of the subject 60 Hz ELF (Extremely Low Frequency) magnetic field survey conducted at various company offices. The purpose of this survey is to quantify the magnetic field levels at the 1 meter height level in various areas in the office space in order to determine whether the field levels would cause interference to electrical equipment (e.g. video display terminal – VDT). All measurements were recorded in milligauss (mG) using a Dexsil Field STAR 4000 ELF (60 Hz) Gauss meter.
Discussion
Magnetic fields are present wherever a current source exists. The strength of the resulting magnetic field is directly proportional to the current magnitude and inversely proportional to the cube or square of the distance from the current source (depending on the current source’s geometry).
Elevated magnetic fields are typical causes of VDT (video display terminal) interference. The threshold level where magnetic fields begin to cause observable VDT interference is approximately 10 milligauss (mG). When the magnetic fields exceed this VDT interference threshold, “jittering” effects are observable on some VDTs (depending on the sensitivity of the monitor). The sensitivity levels, however, are not clearly documented at this time and they may be dependent on several variables, including the computer’s operating system.
Findings
The initial interference source in office 6C-26 was the electric clock located adjacent to the PC in the south-east corner of the office. The clock generated magnetic fields as high as 890 milligauss. Once the clock was removed, the distortion on the PC ceased to exist; however, elevated fields were measured along the westerly perimeter as well as the north-end of office 6C-26.
After the electric clock was removed, the elevated magnetic fields measured in the surveyed space were mainly due to the proximity of current sources such as the electrical distribution equipment located outside of the building as well as in the basement of the building. These sources, situated on the north-west side of the building, include the building switchgear and associated bus details, in addition to the transformer’s and the building’s electric service cables. Since magnetic fields are directly proportional to the source’s current magnitude and physical configuration, we could expect these levels to vary as the loading of the building fluctuates.
Field Management
In the event that VDT interference becomes an issue in the future, I have listed below some field management options that may be considered; each with limitations, advantages and disadvantages.
-
Locate the sensitive electronic equipment (e.g. PCs) in lower field areas within the office space where the field levels are less than the 10 mG interference threshold for VDTs. Since magnetic fields generally diminish with the square of the distance from the source, the further away from the source, the lower the levels will be.
-
Obtain software (SETVSCAN) which is available to mitigate the magnetic field interference on some computer VDTs. This software is only effective on IBM compatible PC’s operating in the non-WindowsTM mode. Some video graphics adapter (VGA) interface cards are supplied with their own software code for mitigating interference in the WindowsTM mode.
-
Install shielding enclosures around the existing VDTs that experience visual distortion (“jittering”). Typical cost for enclosures range between $600 – $1000 each.
-
Install wide area plate shielding along the walls and floors of the impacted areas as well as the ceiling of the switchgear room. The materials required for magnetic shielding typically possess ferromagnetic properties such as iron, low carbon steel and/or special alloys, e.g. Mu-metal®. This solution may not always be physically possible or practical. Assuming it is possible, it can be a very expensive option and usually the most disruptive. Installation is also a very tedious and meticulous process since the material must be handled with special care and no gaps in the shielding are allowed.
Health Issues:
In October, 1996, the National Academy of Sciences completed a 5-year review of information on the possible health effects of EMF exposure. The report concluded:
“Based on a comprehensive evaluation of published studies relating to the effects of power-frequency electric and magnetic fields on cells, tissues, and organisms (including humans), the conclusion of the committee is that the current body of evidence does not show that exposure to these fields presents a human health hazard. Specifically, no conclusive and consistent evidence shows that exposures to residential electric and magnetic fields produce cancer, adverse neurobehavioral effects, or reproductive and developmental effects”. (Source: National Research Council: Possible Health Effects of Exposure to Residential Electric and Magnetic Fields. National Academy Press, 1996, page 1).
At present, there are no regulations which limit exposure to electric and magnetic fields. However, two organizations have published guidelines for EMF exposures. These guideline levels, summarized below for magnetic fields, are several orders of magnitude higher than the fields we measured at your facility:”
International Commission on Non-Ionizing Radiation Protection Guidelines
|
Occupational |
General Public |
||
|
Whole working day |
5,000 mG |
Up to 24 hours per day |
1,000 mG |
|
Short term (2 hours per day) |
50,000 mG |
Few hours per day |
10,000 mG |
|
Limbs |
250,000 mG |
American Conference of Governmental Industrial Hygienists
Occupational exposures 10,000 mG
Workers with pacemakers 1,000 mG
Reference literature published by the Environmental Protection Agency (EPA), Carnegie Mellon University, Con Edison and The New York Times as follows:
-
EPA: EMF In Your Environment – Magnetic Field Measurements Of Everyday Electrical Devices
-
EPA: Questions and Answers About Electric And Magnetic Fields (EMFs)
-
New York State Department of Health: Power Lines Project Questions and Answers
-
Carnegie Mellon University: Electric and Magnetic Fields from 60 Hertz Electric Power: What do we know about possible health risks?
-
Carnegie Mellon University: Measuring Power-Frequency Fields
-
Carnegie Mellon University: What Can We Conclude From Measurements Of Power Frequency Fields
-
The New York Times: “Electrical Emissions: Dangerous Or Not?”
-
Con Edison: Electric and Magnetic Fields Q&A
Case Study #6
EMF Elevated Neutral Current
Promotions Company Tarrytown, New York
Background: Video Terminal interference
Results from the monitoring equipment installed at the service entrance provided the following: we found the voltage to be within design specification limits. On the other hand, the current readings were not balanced. Two of the three phases were within 20% of each other, which is typical. The middle phase current was 40 to 50% of the other phases during peak loading periods. The imbalance causes a resultant neutral current which could attribute to the interference affecting computer monitors. This neutral current is between 21 to 54% of the highest phase current. A well designed system with balanced linear loads would result in zero neutral current. Since a mixture exists between three phase and single phase non-linear loads, the balancing of the phases may not result in zero current in the neutral conductor. However, balancing the loads would minimize the neutral current.
Problems which could result from unbalanced systems are:
-
Overheating of neutral conductors and connections. The result could cause overvoltage and subsequent damage to equipment (Note: the neutral is an unprotected conductor and could result in failure.)
-
Intermittent electrical noise, corrupting of digital circuit signals, computer lockups and other malfunctions
-
Transformer overheating, insulation damage and failure
-
Distortion of line voltage, which could result in overheating of motors
-
Nuisance tripping of relays and circuit breakers
Recommended Solutions
-
Avoid using a shared neutral conductor for single phase 120 volt outlets on different phases
-
Neutral – ground bonding is to be done at the service entrance only. No neutral-ground bonds should exist in sub panels downstream from the main service panel
-
Ground connection at the sub panel must emanate from the service entrance neutral bond point
Case Study #7
Manager, Building Operations Testing Facility
Thermography Study / Electrical Testing of Feeders and Equipment
The Thermography Study indicates two locations that are listed as an exception. We recorded current readings at each of these locations:
|
Location |
Phase Amperes |
|
Switch Gear Room supply breaker PPBRN |
Black 29, Red 36, Blue 30 |
|
Pump Room Distribution panel PPRN Pos. 27 |
19 |
|
Boiler Room Pump # 9 (Pos. 27,28, & 29) Pos. 29 |
20 |
|
Pos. 31 |
19 |
We also found a coupling on pump No. 8 which requires attention. Ultrasound was used to locate the audible noise.
In the test distribution panel we discovered a shared neutral. The neutral was found carrying 17.6 amperes. This neutral is connected with breaker No. 6 high voltage LP CN lighting.
We recorded current readings on the feed to this distribution panel as follows:
|
Conductor |
Amperes |
|
Left (Brown) |
37.2 |
|
Middle (Orange) |
35.7 |
|
Left (Yellow) |
10.23 |
|
Neutral (White) |
23.6 |
It is recommended that you run a dedicated circuit to each device rather than use a shared neutral. The concern with neutral current is the rating of the conductor; neutral current can be 1.73 times the current of the phase conductor.
Case Study #8
Results of Air Drop Test Leakage Evaluation on a Major Nuclear Generator
A nuclear generating plant was experiencing leaks on the Hydrogen line and called in the Power Quality group to assist in locating the leak, specifically for their expertise and the use of Ultrasound as a tool for detecting a leak.
We were able to identify a number of leaks. We were able to utilize two ultrasound devices and completed the task in one visit! This action averted a forced outage and shutdown to the nuclear cooling system.
Results
The air drop test and leakage location evaluation provided the following results. Calculation results show 1400 cubic feet of air per day or an equivalent 4800 cubic feet of H2 per day loss. Using both leak tek and ultrasonic scanning we found a major leak in the bottom southeast corner manway cover and a few other bolts along the south east side of the dome cover plate. The bolts have been identified with a marker.
Using the ultrasound device, we were able find an unusual sounding condition just below 22A H2 tube bundle on the north side. This could possibly be a tube leak, which would cause some H2 loss into the Service Water System. Based on this finding start up should not be performed until the issue is looked at and resolved during the next RFO (Request for Outage).
If we consider the total loss of air and its equivalent H2 on a per minute basis we would have approximately 1 cubic foot per minute of air or 3.38 cubic feet per minute of H2 loss.
With the detected loss in the manway and the possible loss within the coolers I believe we should get a significant improvement by tightening the manway bolts and other bolts as indicated or replacing the gasket entirely. Another air drop test should be performed according to Procedure 26.2.4 and the latest revision of Procedure 26.2 which has just been approved.
Again the cooler leak should be left to review and inspect at the next RFO.
A Work Order has been written to address this corrective action.
Case Study #9
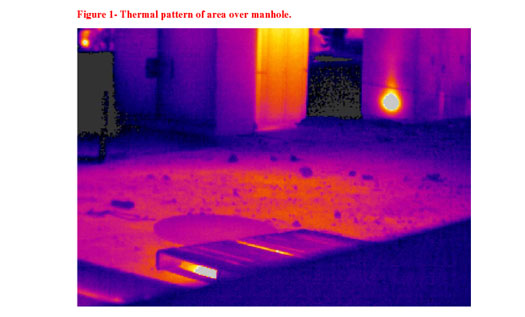
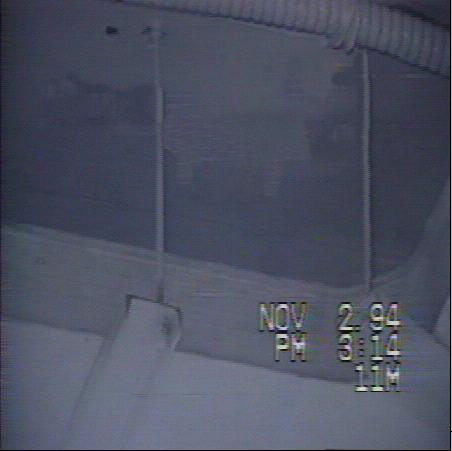
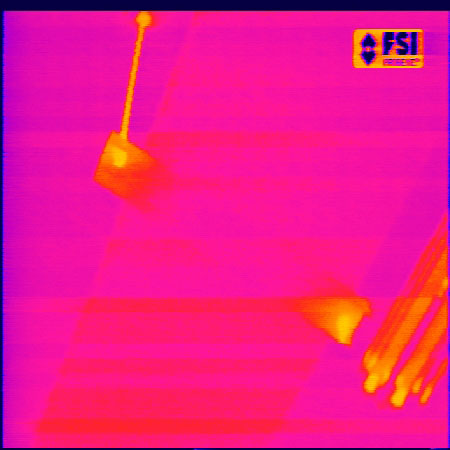
A large commercial customer, noticing that snow was melting at a quicker rate in an area where Con Edison’s pad-mount transformer and the customers transition manhole was located, called in the utility for some help and answers. Further investigation revealed that a large amount of moisture was building up at the customer’s 265/460 volt electrical switchgear.
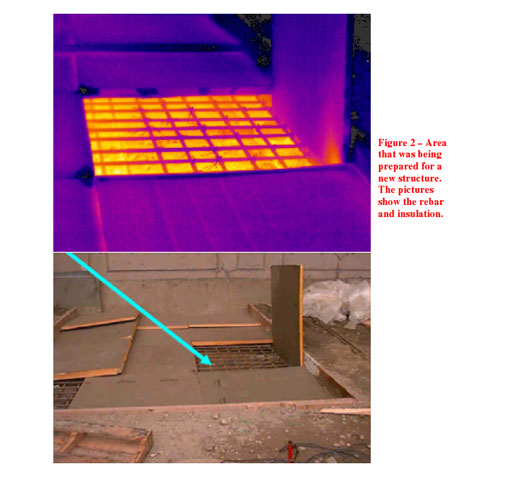
With the need to see what was happening thermally, I was brought in to inrfrared and possibly pinpoint the anomaly. The first thermal pattern I noticed was the ground between the transformer and the customer’s service entrance. Specifically, the area where the customer’s transition manhole was located was hotter than the surrounding area. (Figures 1 and 2)
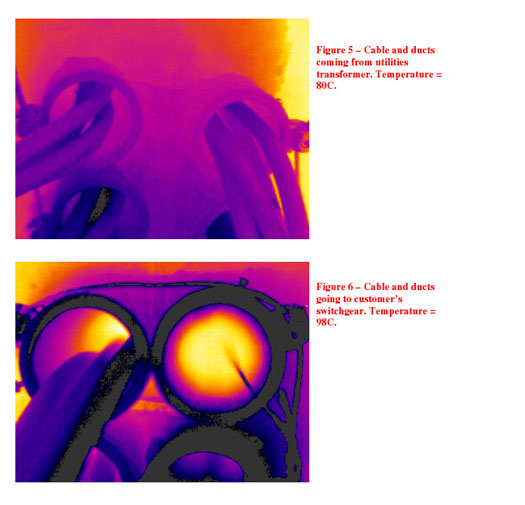
Upon further investigation of the manhole, I noticed that the cable and ducts coming from the transformer were running 15C-20C degrees cooler than those cables and ducts going to the customer’s service entrance. (Fig 5 & 6) The cable joints in the manhole all looked normal thermally.
Our next area to investigate brought us to the customer’s switchgear, specifically the C.T. cabinet. The cabinet was located at the entrance to the indoor parking garage, about 50 feet from the customer’s manhole. It was at this point we realized the customer had a dangerous wanter and electrical problem.
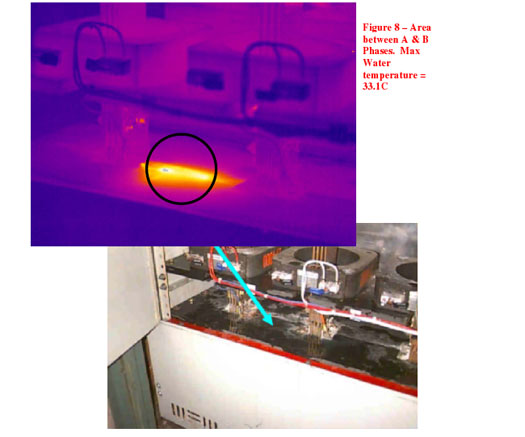
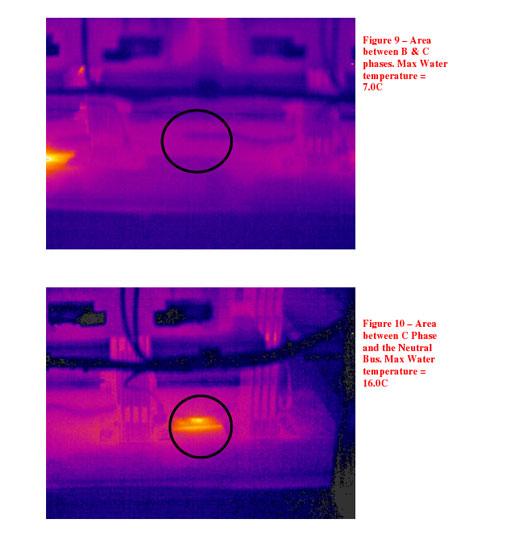
It looked like it was raining in the cabinet. Condensation was forming all over the cabinet and on the electrical equipment. I took some digital pictures for the report and decided to take an infrared picture to see if anything else showed up. Much to the astonishment of all the engineers and electrical experts, we saw that the water was heating up between A and B phases and also between C phase and the neutral bus.
Danger signals went up. We took voltage readings of the water. The readings showed that there was 60 to 70 volts, line(water) to neutral. It was determined that there was enough sediment in the water to cause “TRACKING”. (Figures 8,9 &10)
Summary
It was clear that a much more extensive investigation between the manhole and the customer’s service entrance was needed. This required extensive planning due to the fact that the customer would need an outage.
Over the weekend, with the help of the Utility, the customer’s electricians investigated the cables and duct from the customer’s manhole to the service entrance and the problem was found. A high impedance fault was found on the customer’s side ducts. This caused the area where the ducts were laid to heat up, which in turn caused a condensate problem (steam). The occupied ducts now became load-carrying conductors that heated the adjacent soil causing steam and condensate. The unoccupied ducts going to the switchgear now carried steam to the cabinet that was exposed to the cold weather. The mixture of steam and the cold cabinet now formed the condensate problem that manifested itself in the form of puddles of water between the live bus detail. The potential for a disaster was averted.
Case Study #10
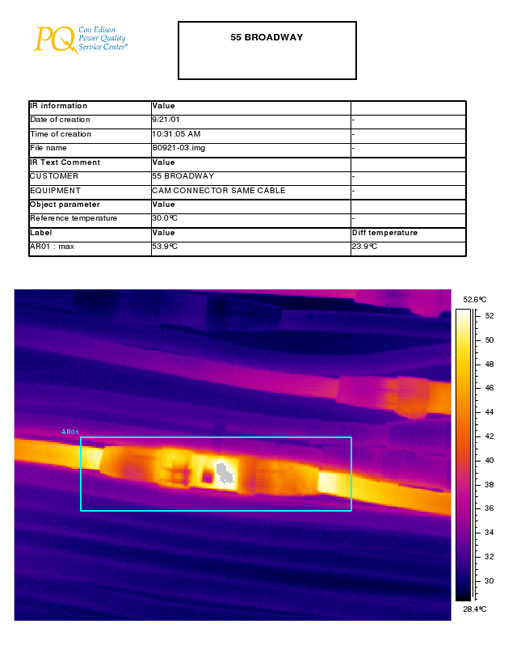
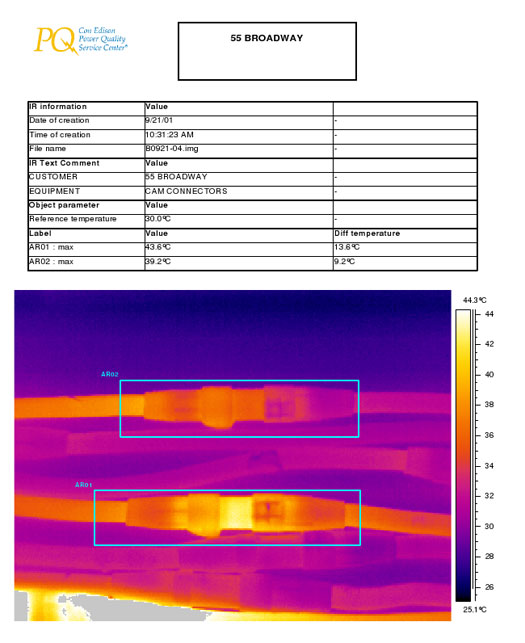
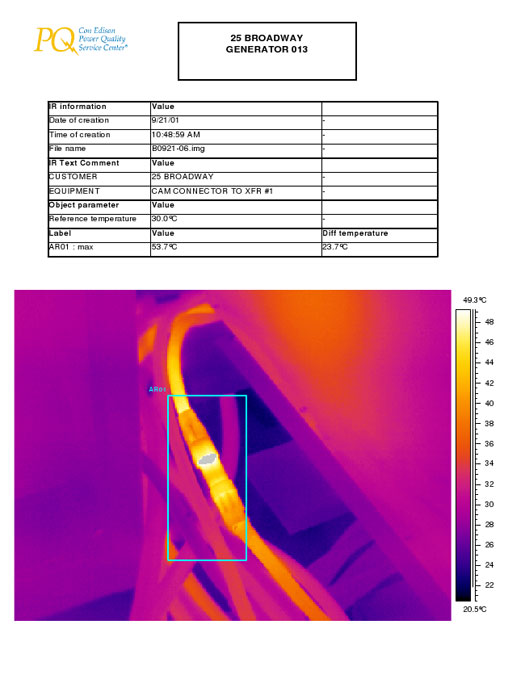
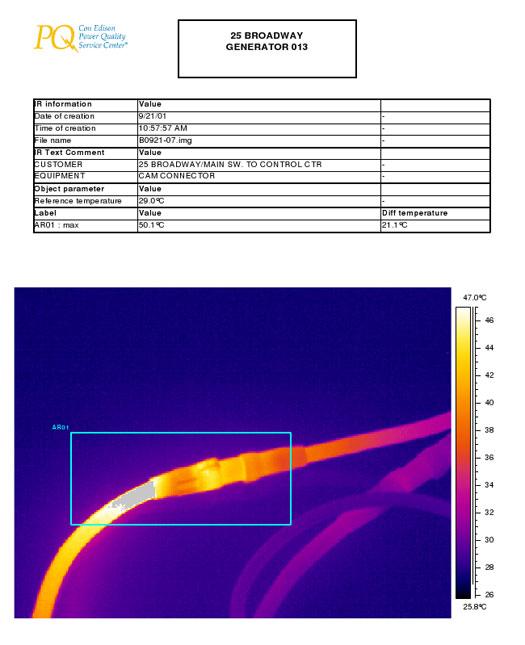
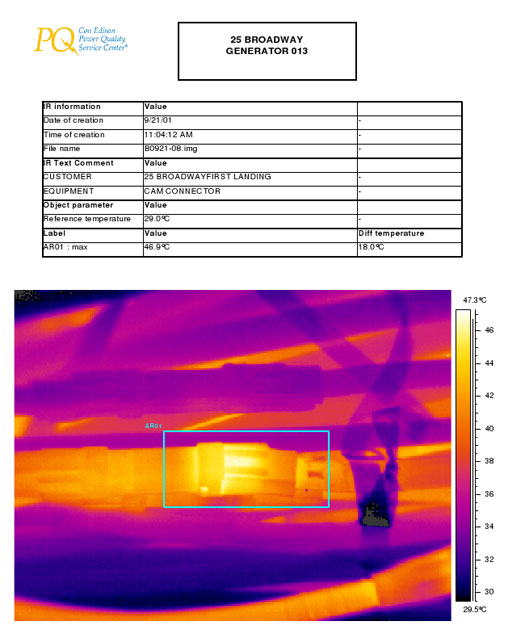
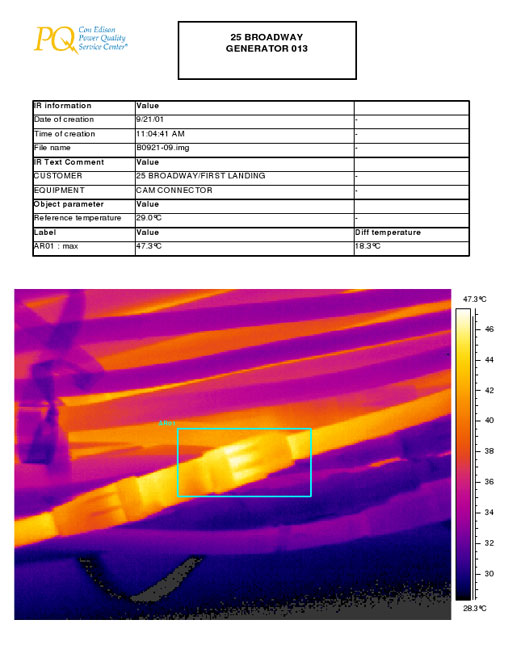
Portable Generator connections Wall Street – Infrared
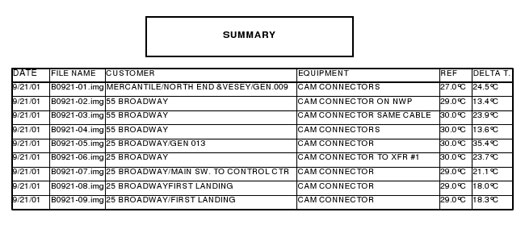
Local Utility provides portable generation to the downtown mercantile area in Manhattan. After the event of September 11, 2001 the utility connected the portable generators as requested to provide power until normal power could be restored. A review of the terminal connections was requested and performed utilizing Infrared.
The results indicated issues at the terminals which required attention in order to avoid failure. The results are provided in the scans that follow.
The connections were addressed and corrected. Thermal scans were conducted after the connections were remade producing satisfactory results.
The scans displayed were taken 10 days after 9/11 after the utility installed many generators in the Wall Street area. The project manager was concerned that the connections were subject to failure. The scans confirm his concern. IR Scans were performed until the generators were disconnected.
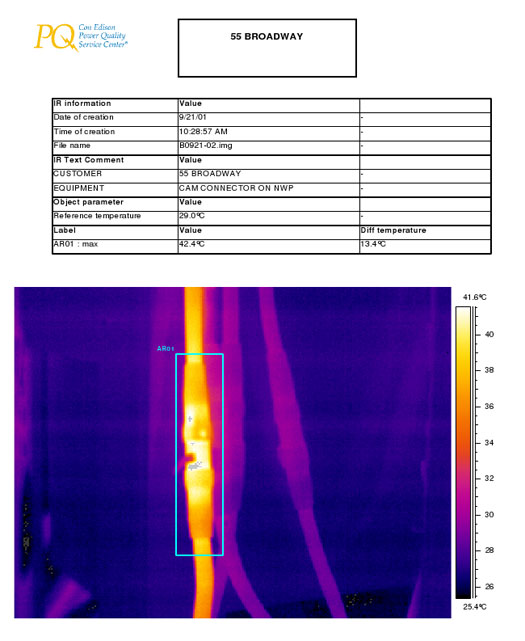
55 Broadway
55 Broadway
55 Broadway
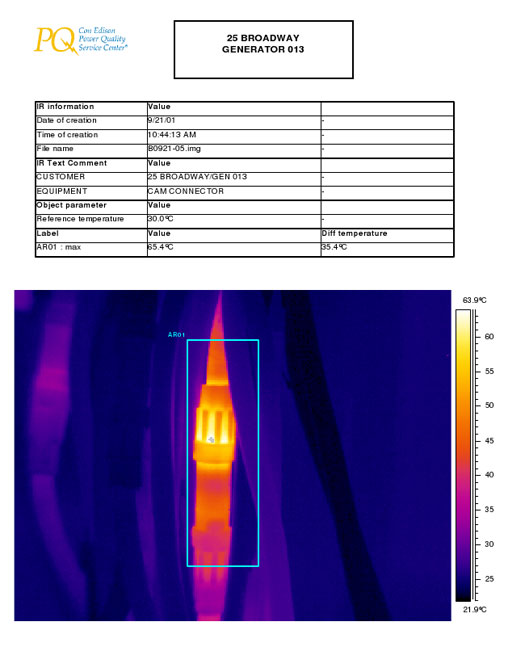
Generator 013
Generator 013
Generator 013
Generator 013
Generator 013
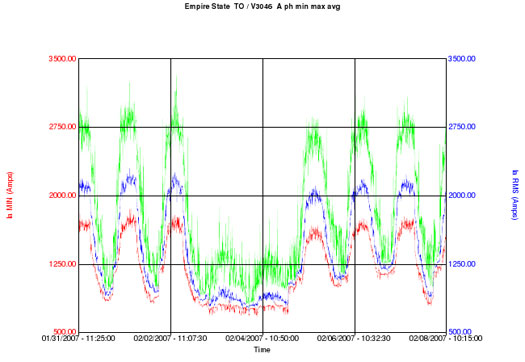
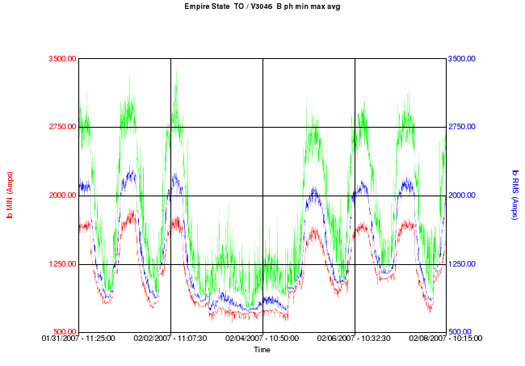
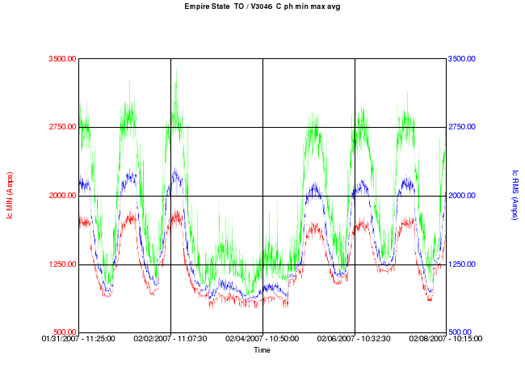
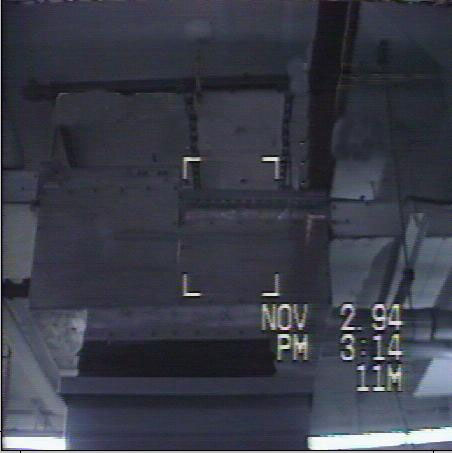
Case Study #11
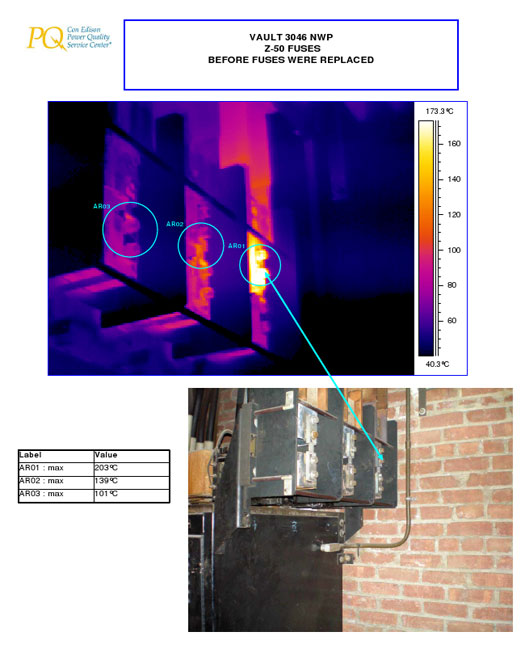
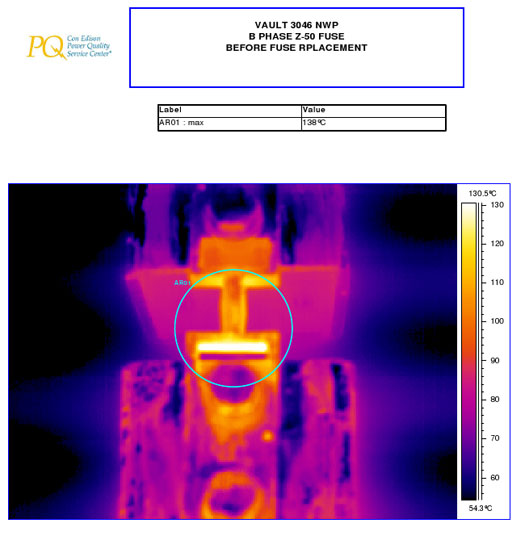
Network Vaults within a Building Fuse Issue Due to Load Growth
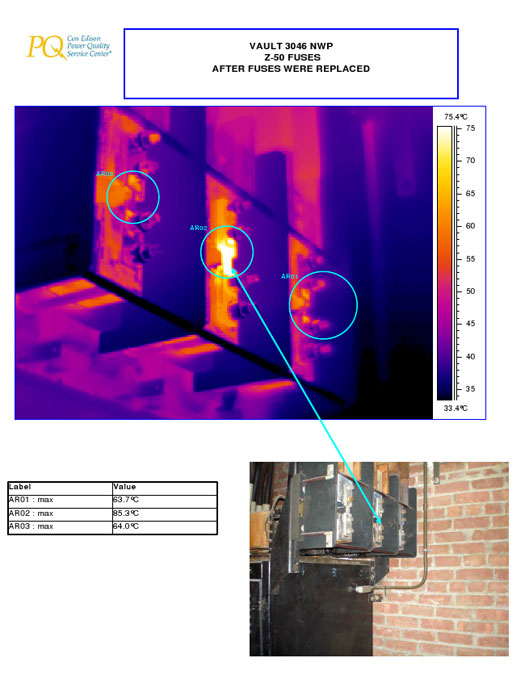
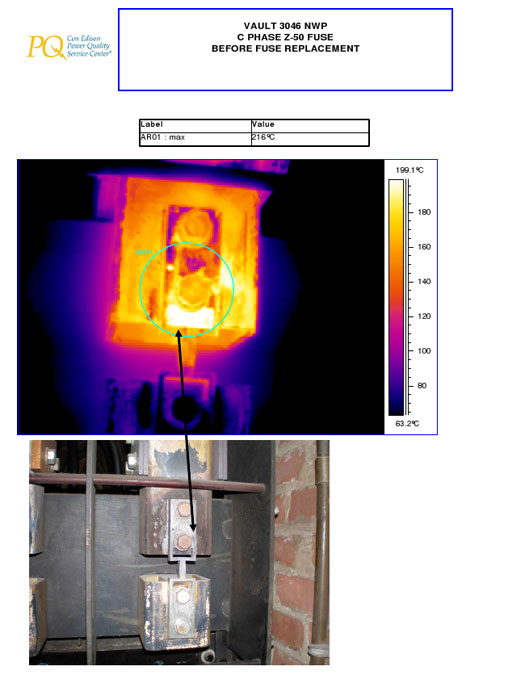
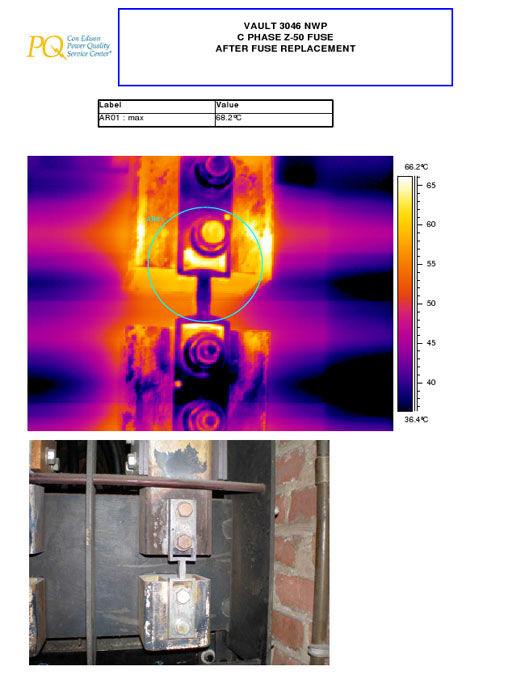
A landmark building in Manhattan which contains a vertical network was considering adding load off one of its network supplies located on the 84th floor. The Building Engineer was concerned about adding the additional load to the network supply takeoff. In evaluating the additional load the Energy Services group requested the assistance of the Power Quality Group (PQ). The PQ Group installed meters to determine the load of a take-off just below the building’s Observation Deck. PQ Group worked with the Building Engineer in order to determine the present load and if the supply could accept additional loading. Two Metrosonic power monitors were set on the take-off fuses in the network protector room. When the PQ group returned to download the data they noticed that one of the Flex CT’s had started to melt. At this point it was decided to take some IR scans. The IR scans revealed that the C phase fuse was quite hot. PQ Group contacted the network service group for a follow-up investigation. The network group performed their investigation that night. They conducted an outage during which they replaced all the fuses and installed new hardware. The findings and the results are provided in the table below. As you can see by the table and charts the load was nearing max. The consultants had to come up with a different approach for the additional load.
|
A Phase (AR03) |
B Phase (AR02) |
C Phase (AR01) |
|
|
Initial Scan |
101o C |
139o C |
203o C |
|
After fuse change |
64o C |
85o C |
63o C |
|
Max amperes |
3400 |
3400 |
3400 |
|
RMS amperes |
2200 |
2200 |
2200 |
|
Min amperes |
1800 |
1800 |
1800 |
Vault 3046 NWP
Vault 3046 NWP C Phase
Vault 3046 NWP C Phase
Vault 3046 NWP B Phase
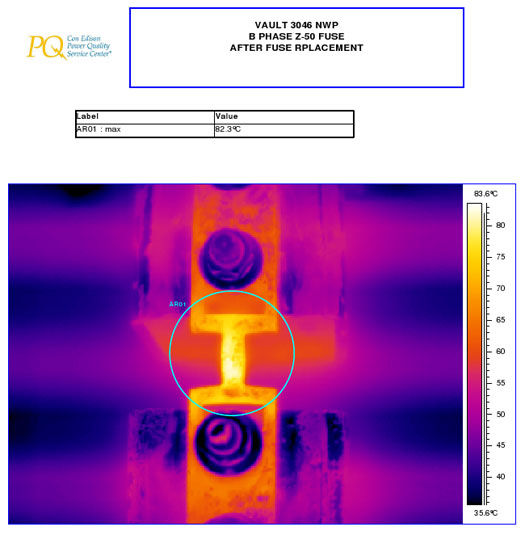
Vault 3046 NWP B Phase
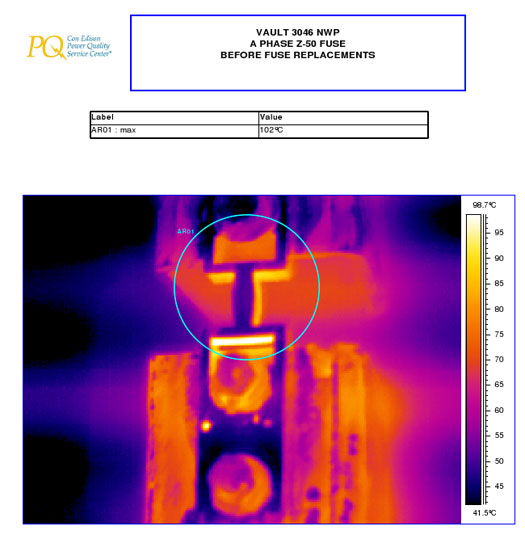
Vault 3046 NWP A Phase
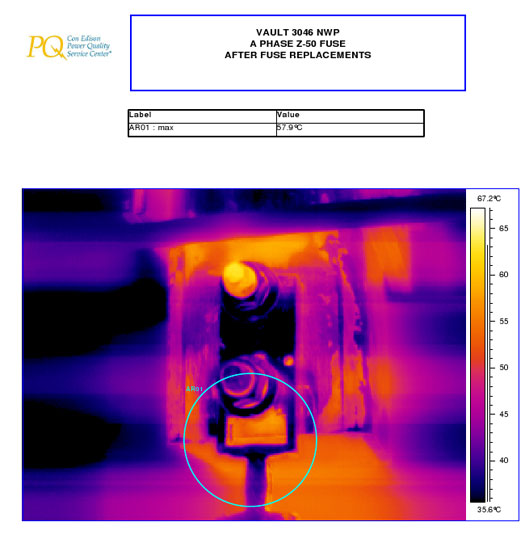
Vault 3046 NWP A Phase
Case Study #12
Calvert Bus 125 Amperes Flowing Through the Ground – Upstream Wiring Error
The PQ group was requested to take thermal scans of a newly installed automatic transfer switch (ATS) and its cable run.
The ATS location is in the garage area where the supply feeders run from the supply to the ATS and to the load it serves. While the PQ group was setting up for the IR scan, the maintenance attendant started to remove the covering of the Calvert bus raceway and as he was removing the last bolt and panel, sparks flew. IR scans were performed and current readings were taken on a support rod that indicated it was hot and carrying 125 amperes. Further investigation revealed that they had forgotten to attach the grounding bar on the outside of the Calvert Bus. A support rod for the raceway connected to the building steel when scanned was carrying the ground current and the heat signature was captured in the IR scan. There was also a wiring error on the upper floor that contributed to ground current. Both items were corrected, resolving the ground current.
References
Consolidated Edison Power Quality Service Center (CEPQSC)
http://www.coned.com/
Electric Power Research Institute, Power Electronics Application Center (EPRI PEAC)
http://www.epri-peac.com/
Field Management Services (FMS)
http://www.fms-corp.com/
National Electric Manufacturers Association (NEMA) standards
http://www.nema.org/
National Electric Code (NEC) National Fire Protection Agency 70(NFPA 70)
https://www.nfpa.org/aboutthecodes/AboutTheCodes.asp?DocNum=70&cookie%5Ftest=1
Frank A. Sinicola
Frank Sinicola received a BSEE from Fairleigh Dickinson University and a MBA from Long Island University. Presently he is the principal of GFI, a consulting company performing utility related tasks for clients. Frank spent most of his professional career at Con Edison, the Public Utility of New York City and Westchester County. He has worked in a variety of engineering disciplines, including Customer Project Manager in the Customer Service Power Quality Group and Application Manager for Distributed Generation/Power Quality. He has presented papers on power quality issues at IEEE and at EPRI conferences and co-authored a study on ‘Improving Elevator Drive System Ride-through Performance’. During his 32 plus years at Con Edison, he has had substation, transmission and distribution engineering and operations experience in both overhead and underground systems.
Frank is a Certified Power Quality Professional, a certified Electrical Inspector and a Level II Certified Infrared Thermographer. He is a member of AEE, IEEE and IAEI. He served on the advisory board of EPRI (Electrical Power Research Institute), on the Primen Power Integrity Advisory Group (EPRI subsidiary), and is on the Association Energy Engineers (AEE) power quality certification board.